plotTOASpectrum
Syntax
Description
Estimate and plot the signal time-of-arrival (TOA) spectra for all L anchors.
[
plots the time-of-arrival (TOA) spectrum of the toagrid,toaspectrum,toaest] = plotTOASpectrum(estim,freqspacing)phased.TOAEstimator
System object™
estim. The object function also returns the TOA grid,
toagrid, the TOA spectrum, toaspectrum, and the
estimated TOA from the phased.TOAEstimator
System object
estim. The input freqspacing is the frequency
spacing of each channel estimate.
To use this function, you must first create and execute the phased.TOAEstimator
System object
estim.
[
also specifies one or more name-value arguments, in addition to the input arguments from the
previous syntax. For example, toagrid,toaspectrum,toaest] = plotTOASpectrum(___,Name=Value)AnchorIndex=4 specifies the fourth anchor
in the channel (see Name-Value Arguments). You can specify multiple name-value pair arguments in any order as
Name1=Value1,...,NameN=ValueN.
Examples
Use received signals from five anchors having known positions to perform FFT-based TOA estimation. Obtain TDOA measurements,and then perform two-step WLLS-based TDOA positioning. Use the data from the TOAEstimatorExampleData file, which contains these variables:
Variable | Definition |
|---|---|
toa | Anchor TOAs |
N | Number of sub-bands |
M | Number of channel samples |
freqspacing | Frequency spacing |
npow | Noise power |
anchorpos | Anchor positions |
tgtpos | Actual target position |
First, load the data from the file.
load TOAEstimatorExampleDataCreate an exponential signal in a noise-free frequency-domain channel.
expsignal = exp(-1j*2*pi*(1:N)'*freqspacing*toa);
Create frequency-domain channel estimate.
X = cell(1,L);
for l = 1:L
    X{l} = expsignal(:,l)*ones(1,M) + ...
        sqrt(npow/2)*(randn(N,M)+1j*randn(N,M));
end
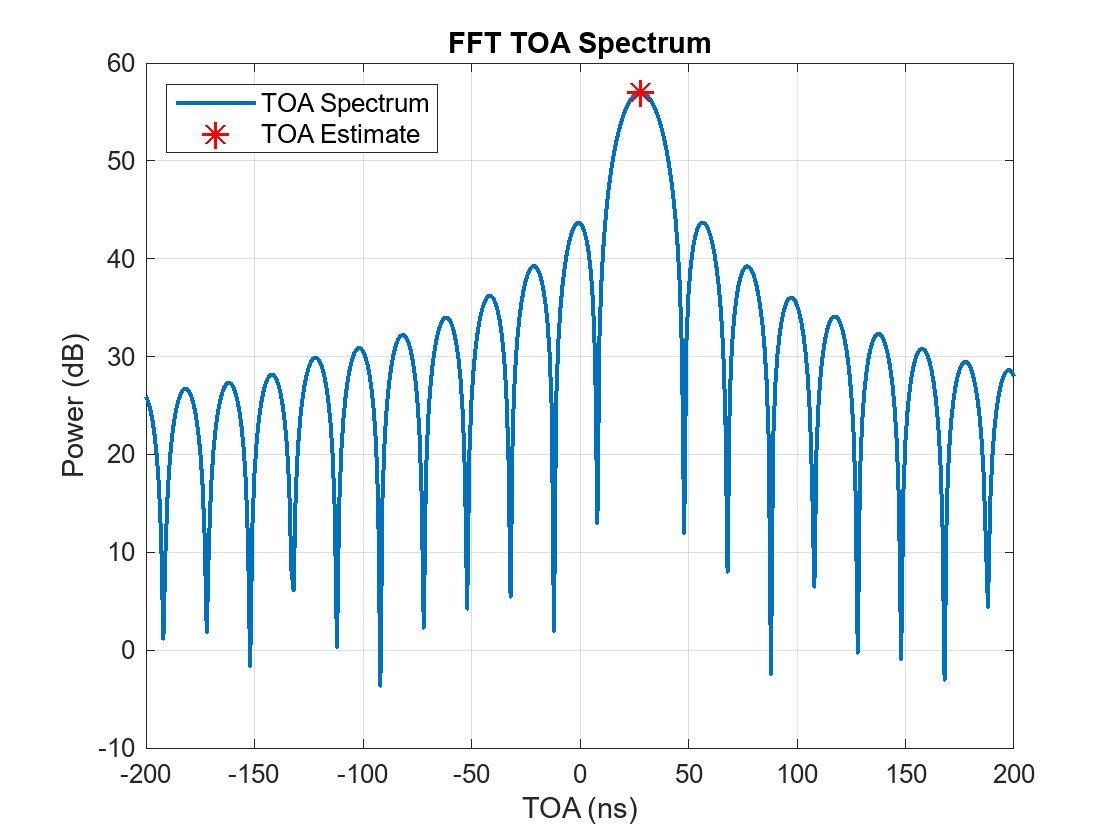
Configure a TDOA estimator to perform FFT-based spectrum analysis.
tdoaEstimator = phased.TOAEstimator(Measurement="TDOA", ...
    SpectrumMethod="FFT",NoisePower=npow, ...
    VarianceOutputPort=true,TargetPositionOutputPort=true);
Estimate TDOA from the estimated TOA.
[tdoaest,tdoavar,tgtposest] = tdoaEstimator(X,freqspacing,anchorpos);
Find the rmse target position estimate.
rmsetgtpos = rmse(tgtposest,tgtpos);
disp(["RMS TDOA positioning error = ",num2str(rmsetgtpos), "meters."])
"RMS TDOA positioning error = " "0.10657" "meters."
Plot the TOA spectrum.
[toaGrid,toaSpectrum,toaEst] = plotTOASpectrum( ...
    tdoaEstimator,freqspacing,AnchorIndex=1, ...
    MaxDelay=200e-9);
Use received signals from five anchors having known positions to perform FFT-based TOA estimation. Obtain TDOA measurements,and then perform two-step WLLS-based TDOA positioning. Use the data from the TOAEstimatorExampleData file, which contains these variables:
Variable | Definition |
toa | Anchor TOAs |
N | Number of sub-bands |
M | Number of channel samples |
freqspacing | Frequency spacing |
npow | Noise power |
anchorpos | Anchor positions |
tgtpos | Actual target position |
First, load the data from the mat-file:
load TOAEstimatorExampleDataCreate an exponential signal in a noise-free frequency-domain channel.
expsignal = exp(-1j*2*pi*(1:N)'*(freqspacing*toa));
Create frequency-domain channel estimate with added Gaussian white noise.
  X = cell(1,L);
  for l = 1:L
      X{l} = expsignal(:,l)*ones(1,M) + ...
          sqrt(npow/2)*(randn(N,M)+1j*randn(N,M));
  end
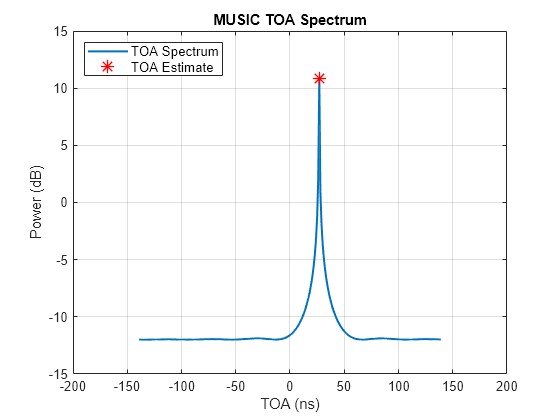
Configure TOA estimator for MUSIC-based spectrum analysis.
toaEstimator = phased.TOAEstimator(Measurement="TOA", ...
SpectrumMethod="MUSIC",VarianceOutputPort=true, ...
NoisePower=npow,ForwardBackwardAveraging=true, ...
SpatialSmoothing=ceil(N/2));
Perform TOA estimation.
[toaest,toavar] = toaEstimator(X,freqspacing);
Perform TOA-based position estimation.
[tgtposest,tgtposcov] = toaposest(toaest,toavar,anchorpos);
Compute the RMSE target position estimate.
rmsepos = rmse(tgtposest,tgtpos);
disp(["RMS TOA positioning error = ", num2str(rmsepos), " meters."])
"RMS TOA positioning error = " "0.10669" " meters."
Plot the TOA spectrum.
[toaGrid,toaSpectrum,toaEst] = plotTOASpectrum( ...
    toaEstimator,freqspacing,AnchorIndex=1, ...
    MaxDelay=200e-9);
Input Arguments
Name-Value Arguments
Output Arguments
Version History
Introduced in R2024a
See Also
phased.TOAEstimator | phased.TDOAEstimator | toaposest | tdoaposest | plotTDOASpectrum