phased.MatchedFilter
Matched filter
Description
The phased.MatchedFilter
System object™ implements matched filtering of an input signal. To compute the matched filtered
signal:
Create the
phased.MatchedFilterobject and set its properties.Call the object with arguments, as if it were a function.
To learn more about how System objects work, see What Are System Objects?
Creation
Description
mfilter = phased.MatchedFiltermfilter. The object performs matched filtering on the
input data.
mfilter = phased.MatchedFilter(Name=Value)mfilter, with each specified
property Name set to the specified Value. You
can specify additional name-value pair arguments in any order as
(Name1=Value1, ...,
NameN=ValueN).
Properties
Usage
Description
Y = mfilter(X)X and returns the filtered result in
Y. The filter is applied along the first dimension of
X. Y and X have the same
dimensions. Any initial transient is removed from the filtered result.
The size of the first dimension of the input matrix can vary to simulate a changing signal length. A size change can occur, for example, in the case of a pulse waveform with variable pulse repetition frequency.
Input Arguments
Output Arguments
Object Functions
To use an object function, specify the
System object as the first input argument. For
example, to release system resources of a System object named obj, use
this syntax:
release(obj)
Examples
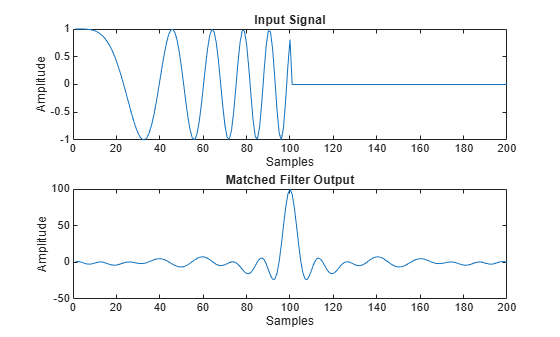
Create a linear FM waveform with a pulse repetition frequency of 5kH. Apply a matched filter derived from the waveform.
waveform = phased.LinearFMWaveform('PulseWidth',1e-4, ...
    'PRF',5e3);
x = waveform();
mfilter = phased.MatchedFilter( ...
    'Coefficients',getMatchedFilter(waveform));
y = mfilter(x);
Plot the real parts of the original waveform and the match-filtered waveform.
subplot(2,1,1)
plot(real(x))
xlabel('Samples')
ylabel('Amplitude')
title('Input Signal')
subplot(2,1,2)
plot(real(y))
xlabel('Samples')
ylabel('Amplitude')
title('Matched Filter Output')
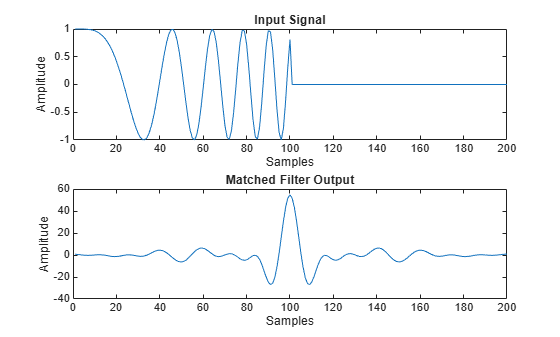
Apply a matched filter, using a Hamming window to do spectrum weighting.
waveform = phased.LinearFMWaveform('PulseWidth',1e-4,'PRF',5e3);
x = waveform();
mfilter = phased.MatchedFilter( ...
    'Coefficients',getMatchedFilter(waveform), ...
	'SpectrumWindow','Hamming');
y = mfilter(x);
subplot(2,1,1)
plot(real(x))
xlabel('Samples')
ylabel('Amplitude')
title('Input Signal')
subplot(2,1,2)
plot(real(y))
xlabel('Samples')
ylabel('Amplitude')
title('Matched Filter Output')
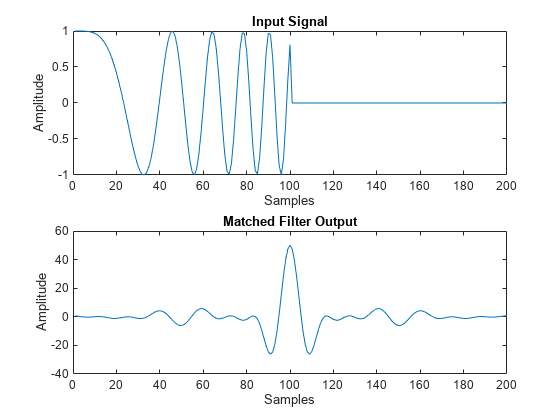
Apply a matched filter to a signal created from a linear FM waveform. Use a custom Gaussian window for spectrum weighting.
waveform = phased.LinearFMWaveform('PulseWidth',1e-4,'PRF',5e3);
x = waveform();
mfilter = phased.MatchedFilter( ...
    'Coefficients',getMatchedFilter(waveform), ...
	'SpectrumWindow','Custom', ...
	'CustomSpectrumWindow',{@gausswin,2.5});
y = mfilter(x);
Plot the real part of the original signal and the match-filtered output.
subplot(2,1,1)
plot(real(x))
xlabel('Samples')
ylabel('Amplitude')
title('Input Signal')
subplot(2,1,2)
plot(real(y))
xlabel('Samples')
ylabel('Amplitude')
title('Matched Filter Output')
Construct a linear FM waveform with a sweep bandwidth of 300 kHz and a pulse width of 50 μs. Obtain the matched filter coefficients using the getMatchedFilter object function. Then, match-filter the waveform.
waveform = phased.LinearFMWaveform('SweepBandwidth',3e5, ...
    'OutputFormat','Pulses','SampleRate',1e6, ...
    'PulseWidth',50e-6,'PRF',1e4);
wav = waveform();
Plot the entire waveform. The length of the waveform is the pulse repetition interval (100 samples).
stem(real(wav))
xlabel('Samples')
title('Real Part of Waveform')

Obtain the matched filter coefficients for the linear FM waveform. The length of the matched filter coefficients is the length of the pulse.
mfcoeffs = getMatchedFilter(waveform);
stem(real(mfcoeffs))
xlabel('Samples')
title('Real Part of Matched Filter Coefficients')

Use the phased.MatchedFilter System object™ to obtain the matched filter output.
mfilter = phased.MatchedFilter('Coefficients',mfcoeffs);
mfoutput = mfilter(wav);
stem(real(mfoutput))
xlabel('Samples')
title('Real Part of Matched Filter Output')

Generate a random data cube where each row corresponds to fast-time samples and each column corresponds to slow-time pulses. This represents a random pulse waveform with a 100% duty cycle.
N = 300;
M = 100;
x = randn(N*M,1)+1i*randn(N*M,1);
x_cube = reshape(x,N,M);
Delay the data cube.
delay = 50;
x_delay = [zeros(delay,1);x(1:end-delay)];
x_delay_cube = reshape(x_delay,N,M);
Apply matched filters to each pulse in the delayed data cube to estimate the delay. The matched filter coefficient is derived from the non-delayed data cube.
mf = phased.MatchedFilter;
mf.CoefficientsSource = 'input port';

y = zeros(N,M);
for m = 1:M
    x_ref = x_cube(:,m);
    x_delay_m = x_delay_cube(:,m);
    mf_coeff = conj(x_ref(end:-1:1));
    y(:,m) = mf(x_delay_m,mf_coeff);
end
Plot the matched filter output in the first three pulses.
figure
subplot(3,1,1)
plot(1:N,abs(y(:,1)))
xlabel('Samples')
ylabel('Amplitude')
title('Matched Filter Output in Pulse 1')
subplot(3,1,2)
plot(1:N,abs(y(:,2)))
hold on
plot(delay,abs(y(delay,2)),'r*')
hold off
xlabel('Samples')
ylabel('Amplitude')
title('Matched Filter Output in Pulse 2')
subplot(3,1,3)
plot(1:N,abs(y(:,3)))
hold on
plot(delay,abs(y(delay,3)),'r*')
hold off
xlabel('Samples')
ylabel('Amplitude')
title('Matched Filter Output in Pulse 3')
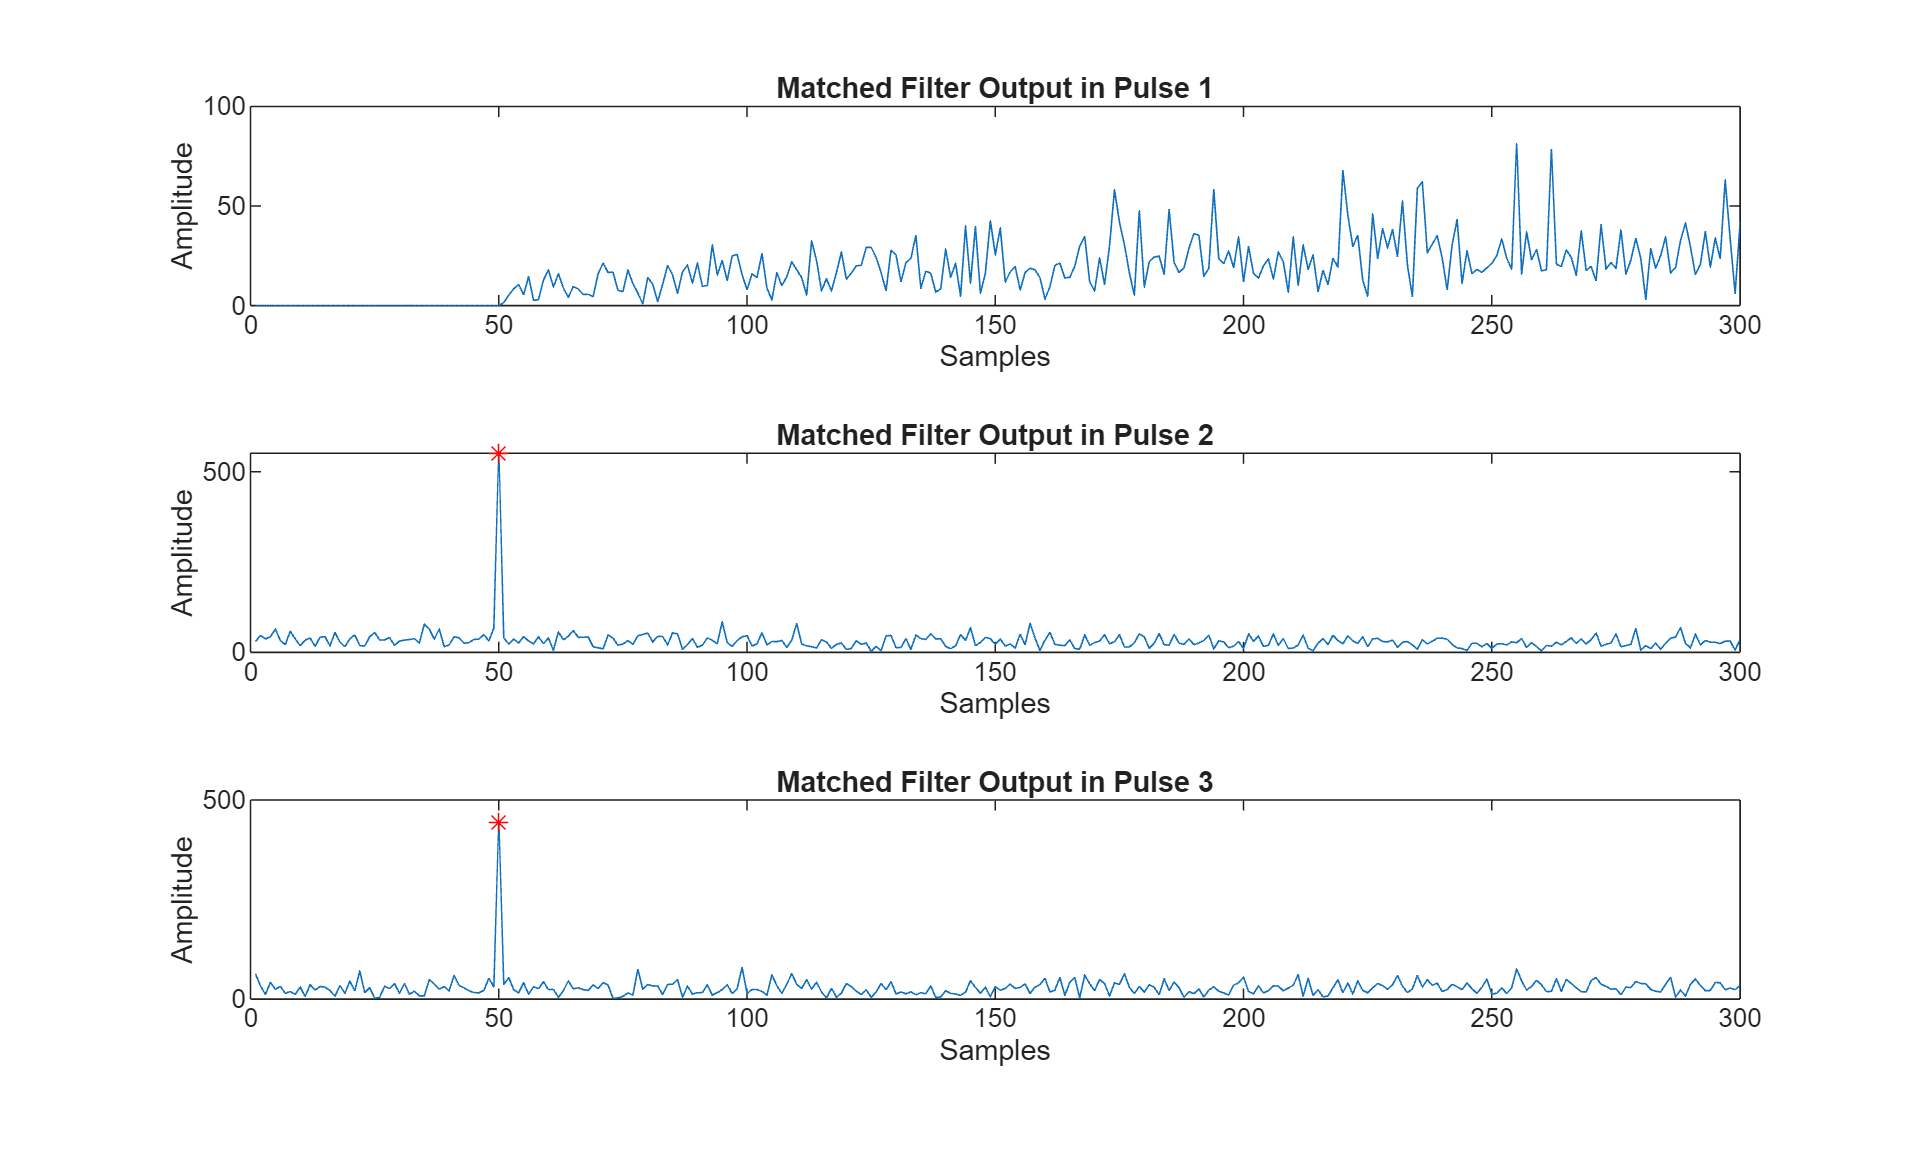
From the above result, we observe that for a random pulse waveform with a 100% duty cycle, the matched filter cannot produce a useful delay response in the first pulse. This is because the delay peak emerges after a matched filter delay of N once the matched filter receives the first sample of the delayed data. Consequently, the matched filter peak for pulse 1 is observed in pulse 2, and the peak for pulse 2 appears in pulse 3.
Algorithms
Spectrum weighting produces a matched filter transfer function
where w(F) is the window and H(F) is the original transfer function.
For a discussion of matched filter theory, see [1] or [2]. The filtering operation uses the overlap-add method [3].
References
[1] Richards, M. A. Fundamentals of Radar Signal Processing. New York: McGraw-Hill, 2005.
[2] Skolnik, M. Introduction to Radar Systems, 3rd Ed. New York: McGraw-Hill, 2001.
[3] Alan Oppenheim and Ronald Schafer, Discrete-Time Signal Processing, Prentice Hall, 1989.
Extended Capabilities
Version History
Introduced in R2011a
See Also
phased.CFARDetector | Stretch Processor | phased.CFARDetector2D | phased.TimeVaryingGain | getMatchedFilter | taylorwin | hamming | chebwin | kaiserwin | barthannwin