meshQuality
R2026bEvaluate shape quality of mesh elements
Description
Q = meshQuality(___,"aspect-ratio")"aspect-ratio" after
any of the previous syntaxes.
Examples
Evaluate the shape quality of the elements of a 3-D mesh.
Import and plot the geometry.
g = fegeometry("PlateSquareHoleSolid.stl");
pdegplot(g)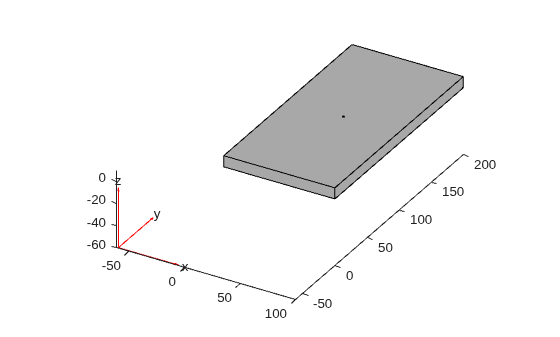
Create and plot a coarse mesh.
g = generateMesh(g,Hmax=35)
g =
  fegeometry with properties:

        NumCells: 1
        NumFaces: 10
        NumEdges: 24
     NumVertices: 16
        Vertices: [16×3 double]
    FeatureAngle: 44
            Mesh: [1×1 FEMesh]
mesh=g.Mesh;
pdemesh(mesh)
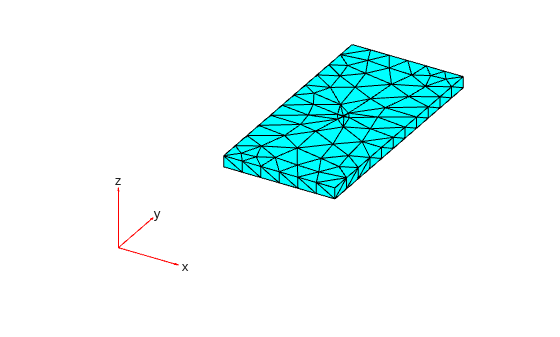
Evaluate the shape quality of all mesh elements. Display the first five values.
Q = meshQuality(mesh);
Q(1:5)
ans = 1×5

    0.8692    0.7119    0.8047    0.7838    0.8417
Find the elements with the quality values less than 0.2.
elemIDs = find(Q < 0.2);
Highlight these elements in blue on the mesh plot.
pdemesh(mesh,FaceAlpha=0.5)
hold on
pdemesh(mesh.Nodes,mesh.Elements(:,elemIDs), ...
                   FaceColor="blue", ...
                   EdgeColor="blue")
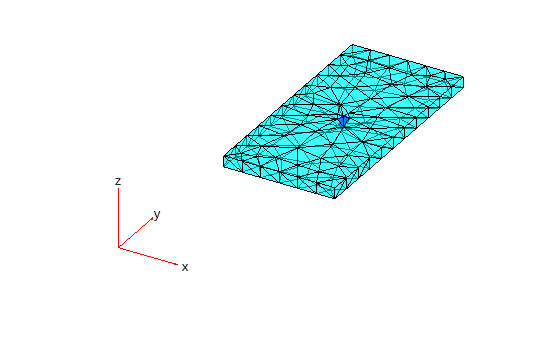
Plot the element quality in a histogram.
figure
hist(Q)
xlabel("Element Shape Quality",FontWeight="b")
ylabel("Number of Elements",FontWeight="b")
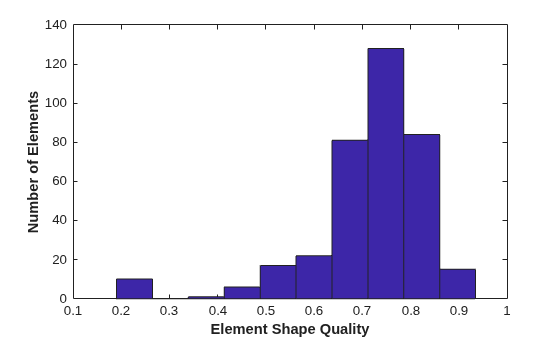
Find the worst quality value.
Qworst = min(Q)
Qworst =
0.1903
Find the corresponding element IDs.
elemIDs = find(Q==Qworst)
elemIDs = 1×2

     8   244
Evaluate the shape quality of the elements of a 2-D mesh.
Import the following geometry.
g = fegeometry("PlateSquareHolePlanar.stl");
pdegplot(g)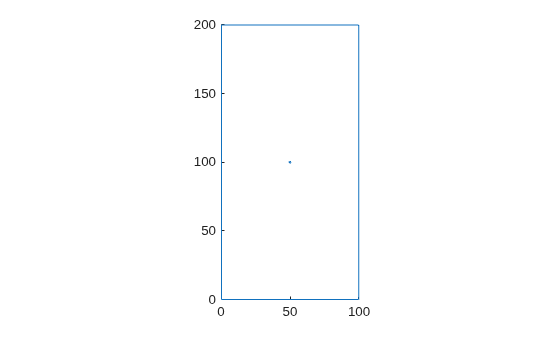
Create and plot a coarse mesh.
g = generateMesh(g,Hmax=20)
g =
  fegeometry with properties:

        NumCells: 0
        NumFaces: 1
        NumEdges: 8
     NumVertices: 8
        Vertices: [8×3 double]
    FeatureAngle: []
            Mesh: [1×1 FEMesh]
pdemesh(g)
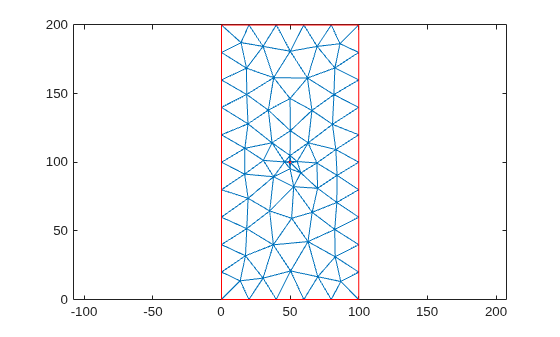
Find the IDs of the elements within a box enclosing the center of the plate.
mesh = g.Mesh;
elemIDs = findElements(mesh,"box",[25,75],[80,120]);
Evaluate the shape quality of these elements. Display the result as a column vector.
Q = meshQuality(mesh,elemIDs);
Q.'
ans = 20×1

    0.8158
    0.4618
    0.9839
    0.5948
    0.3790
    0.3957
    0.3599
    0.6534
    0.9919
    0.6130
    0.7594
    0.7010
    0.7177
    0.6919
    0.9595
      ⋮
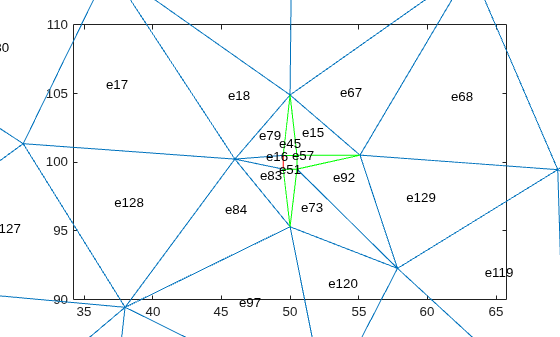
Find the elements with the quality values less than 0.4.
elemIDs04 = elemIDs(Q < 0.4)
elemIDs04 = 1×3

    45    51    57
Highlight these elements in green on the mesh plot. Zoom in to see the details.
figure
pdemesh(mesh,ElementLabels="on")
hold on
pdemesh(mesh.Nodes,mesh.Elements(:,elemIDs04),EdgeColor="green")
zoom(10)
Determine the shape quality of mesh elements by using the ratios of minimal to maximal dimensions.
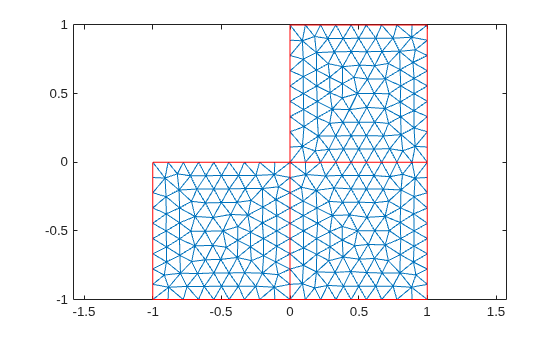
Create a PDE model and include the L-shaped geometry.
model = createpde(1);
geometryFromEdges(model,@lshapeg);
Generate the default mesh for the geometry.
mesh = generateMesh(model);
View the mesh.
pdeplot(model)
Evaluate the shape quality of mesh elements by using the minimal to maximal dimensions ratio. Display the first five values.
Q = meshQuality(mesh,"aspect-ratio");
Q(1:5)
ans = 1×5
0.9964 0.9964 0.5385 0.9605 0.9566
Evaluate the shape quality of mesh elements by using the default setting. Display the first five values.
Q = meshQuality(mesh);
Q(1:5)
ans = 1×5

    1.0000    1.0000    0.8261    0.9992    0.9990
Input Arguments
Output Arguments
Algorithms
By default, meshQuality calculates the shape quality of a
triangular mesh element as follows:
Here, A is the area of the triangle, and li are the edge lengths of the triangle.
meshQuality calculates the shape quality of a tetrahedral mesh
element as follows:
Here, V is the volume of the tetrahedron, li are the edge lengths, and Ak are the areas of the triangular faces.
When you use the aspect-ratio argument,
meshQuality calculates the quality of a triangular mesh element
as follows:
Here, lmax is the maximal edge length of the triangle.
The aspect-ratio quality of a tetrahedral mesh element is:
Here, lmax is the maximal edge length of the tetrahedron, and Amax is the area of the largest face of the tetrahedron:
References
[1] Knupp, Patrick M. "Matrix Norms & the Condition Number: A General Framework to Improve Mesh Quality via Node-Movement." In Proceedings, 8th International Meshing Roundtable. Lake Tahoe, CA, October 1999: 13-22.
[2] Shewchuk, Jonathan R. "What Is a Good Linear Element? Interpolation, Conditioning, and Quality Measures." In Proceedings, 11th International Meshing Roundtable. Ithaca, NY, September 2002: 115-126.
Version History
Introduced in R2018a

