plotSection
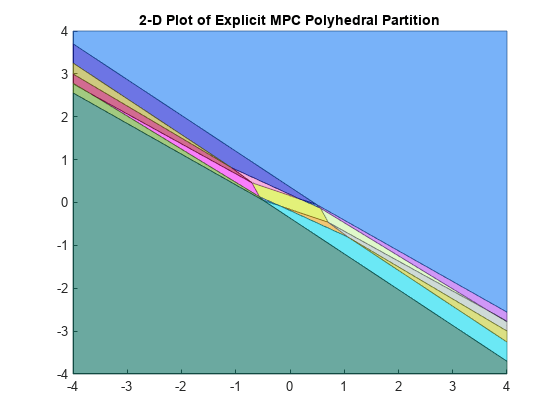
Visualize explicit MPC control law as 2-D sectional plot
Description
plotSection(
displays a 2-D sectional plot of the piecewise affine regions used by an explicit
MPC controller. All but two of the control law’s free parameters are fixed, as
specified by empcobj,plotParams)plotParams. The two remaining variables form the
plot axes. By default, the empcobj.Range property sets the bounds
for these axes.
Examples
Input Arguments
Version History
Introduced in R2014b
See Also
Functions
generatePlotParameters|generateExplicitMPC|generateExplicitRange|generateExplicitOptions|simplify|mpcmoveExplicit|sim
Objects
mpc|explicitMPC|mpcstate
