Fill a Single Lookup Table
You can fill a single lookup table using one of these workflows:
Fill a Lookup Table From Measured Data
Follow these steps to fill a single lookup table from measured data:
Open the Lookup Table Fill Wizard.
With the table selected in the Lookup Tables view, select Table > Fill.
Alternatively, click the Fill toolbar button
 .
.
The Lookup Table Fill Wizard opens.
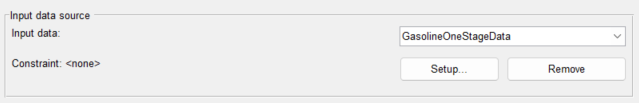
From the Input data list, select a data set.
Click Setup to create a constraint. Constraints filter rows from the input data to restrict the values that CAGE uses to fill the feature.
Set the right drop-down list of Filled by to
Dataand the left drop-down list to the data set column to use to fill the table.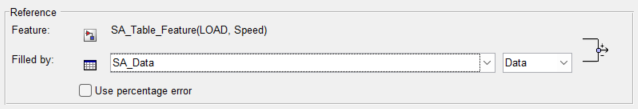
You must set the Smoothing factor to a nonzero value to fill a table from a data set. Smoothing performs an extrapolation for cells in the lookup table data where data is not available. Click Finish.
Optionally, you can turn off smoothing or force the lookup table to be linear for a given direction. From the drop-down lists under Row (Y) or Column (X), select
linearoroff.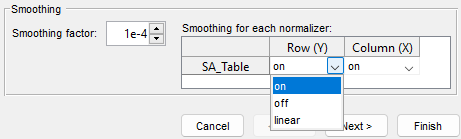
Alternatively, on the Lookup Tables view, use the Smoothing factor to interactively change the smoothing factor after you fill a lookup table.

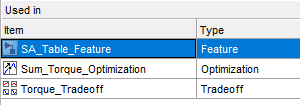
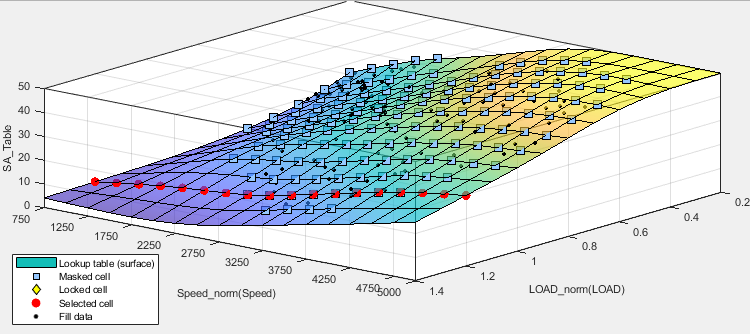
In the Lookup Table view, the black dots represent the filling data. Evaluate the fit of the black dots on the lookup table surface. For more detailed plots of the data fit, navigate to the right side of the Lookup Table view and double-click the feature under Used in to open the Feature view.
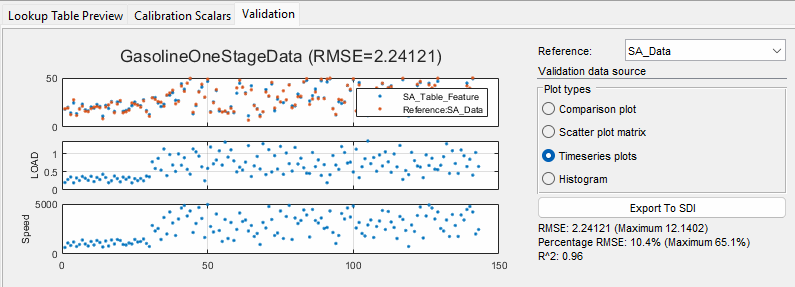
In the Feature view, go to the Validation tab. From Plot types, select plots to evaluate the fit.
Note
Filling a table from a data set produces similar results to using the
fitlookupn function.
Fill a Lookup Table from a Model
Follow these steps to fill a single lookup table from a model evaluated at the table breakpoints:
Open the Lookup Table Fill Wizard.
With the table selected in the Lookup Tables view, select Table > Fill.
Alternatively, click the Fill toolbar button
.
The Lookup Table Fill Wizard opens.
From the Filled by list, select the model that you want to fill the table with.
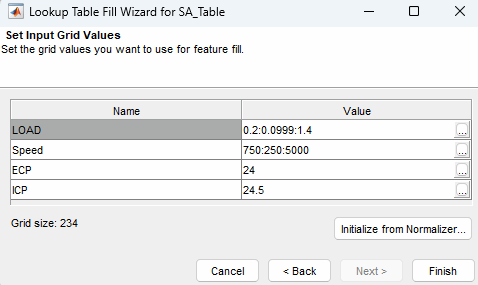
Set Input data to
Grid.Click Setup to create a constraint. Constraints filter rows from the input data to restrict the values that CAGE uses to fill the feature. By default, the toolbox sets Constraint to the boundary model associated with the main model to use the data points within the boundary. You can also define a function model to use as a constraint.
Click Next.
Connect model and feature inputs. Use results from lookup tables as inputs by connecting tables to inputs. Connect variables that describe the same quantities. Click Next.
If you do not connect the model and feature inputs prior to clicking Next, the input grid values are set to an average fit over all values.
If you connect the model and feature inputs, the input grid values are set to the breakpoints of the table values. Click Finish.
In the Lookup Table view, the black dots represent the filling data. Evaluate the fit of the block dots on the lookup table surface.
For more detailed plots of the data fit, navigate to the right side of the Lookup Table view and double-click the feature under Used in to open the Feature view.
In the Feature view, go to the Validation tab. From Plot types, select plots to evaluate the fit.