uihtml
Create HTML UI component
Description
h = uihtml creates an HTML UI component in a new figure and returns
the HTML UI component object. MATLAB® calls the uifigure function to create the
figure.
With the uihtml function, you can embed HTML, JavaScript®, or CSS content in your app and interface with third-party libraries to
display content like widgets or data visualizations. All supporting files (including HTML,
JavaScript, CSS, images) must be saved in a location that your local file system can
access.
h = uihtml(___,
specifies HTML UI component properties using one or more name-value arguments. For example,
Name,Value)uihtml("Position",[230 60 40 150]) creates an HTML UI component with
the specified location and size. Use this option with any of the input argument combinations
in the previous syntaxes.
Examples
Create an HTML component and display formatted text in it using HTML markup.
fig = uifigure('Position',[561 497 333 239]);
h = uihtml(fig);
h.HTMLSource = '<p style="font-family:arial;"><b><span style="color:red;">Hello</span> <u>World</u>!</b></p>';

Create an HTML file to embed audio and video elements in your app and reference media source files.
First, create an empty HTML UI component in a figure.
fig = uifigure;
fig.Position = [500 500 380 445];

h = uihtml(fig);
h.Position = [10 10 360 420];

Then, create an HTML file called audio_videoplayers.html. In the file, add audio and video elements and specify their file sources relative to the path of the HTML file. In this example, the media files are in the same directory as the HTML file.
A good practice is to specify multiple file sources for each element because not all contexts support the same file types. For example, MP4 videos are not supported for HTML components in the MATLAB Desktop but are supported in MATLAB Online™. In the video element, specify an OGA file as the first video for the app to try to play. Then, specify an MP4 file as a fallback if the first file is not supported.
<!DOCTYPE html>
<html>
	<body style="background-color:white;font-family:arial;">
		<p style="padding-left:20px">
		Play audio file:
		</p>

		<audio controls style="padding-left:20px">
			<source src="./handel_audio.wav" type="audio/wav">
			<source src="./handel_audio.oga" type="audio/ogg">
			Your browser does not support the audio tag.
		</audio>

		<p style="padding-left:20px">
		Play video file:
		</p>

		<video width="320" height="240" controls style="padding-left:20px">
                        <source src="./xylophone_video.oga" type="video/ogg">
			<source src="./xylophone_video.mp4" type="video/mp4">
			Your browser does not support the video tag.
		</video>

	</body>
</html>
Now, embed the HTML file in your app by setting the HTMLSource property to the full path to the file.
h.HTMLSource = fullfile(pwd,'audio_videoplayers.html');
Create an htmlComponent JavaScript® object that displays the data that is set on an HTML UI component in MATLAB®.
First, create an empty HTML UI component and position it within a figure.
fig = uifigure;
fig.Position = [500 500 490 180];

h = uihtml(fig);
h.Position = [20 20 450 130];
Then, create an HTML file called displayDataFromMATLAB.html. In the file,
Use a
styletag to define internal CSS styles for the<div>elements that display text.Write a
setupfunction inside of a<script>tag to connect your JavaScript object, calledhtmlComponent, to the HTML UI component you created in MATLAB.Add an event listener within the
setupfunction. The event listener listens for"DataChanged"events on thehtmlComponentJavaScript object and creates a listener callback function. When a"DataChanged"event occurs, the listener callback function updates the"dataDisplay"<div> elementwith the value that is set to theDataproperty in MATLAB.
<!DOCTYPE html>
<html>
<head>
<style>
#prompt {
  font-family: sans-serif;
  text-align:center;
  border-radius: 5px;
  background-color: lightblue;
  padding: 20px;
}

#dataDisplay {
  border-radius: 5px;
  height: 10vh;
  padding: 12px 20px;
}
</style>

<script type="text/javascript">

        function setup(htmlComponent) {

            htmlComponent.addEventListener("DataChanged", function(event) {
            document.getElementById("dataDisplay").innerHTML = htmlComponent.Data;
            });
        }
</script>
</head>

<body>
     <div id="prompt">

	<span><label for="prompt"><strong>Data from MATLAB will display here:</strong></label></span>
	<br/><br/>
	<div id ="dataDisplay">
	Please set data in MATLAB...
	</div>

     </div>
</body>

</html>
Now, in MATLAB, set the value of the HTMLSource property to the path to the HTML file.
h.HTMLSource = fullfile(pwd,'displayDataFromMATLAB.html');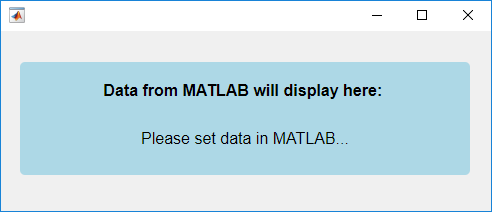
Set the value of the Data property for the HTML UI component. Notice how the htmlComponent JavaScript object updates in your HTML UI component.
h.Data = "Hello World!";
Create a JavaScript
htmlComponent object that shows a button and a progress bar, and
display the current progress in the MATLAB Command Window whenever the progress changes.
First, create an empty HTML UI component and position it within a figure.
fig = uifigure("Position",[500 500 350 150]);
h = uihtml(fig,"Position",[50 40 250 70]);
Then, create an HTML file named progressBar.html. In the
file:
Use a
<style>tag to define internal CSS styles for a button and a progress bar element.Write a
setupfunction inside of a<script>tag to connect your JavaScript object, namedhtmlComponent, to the HTML UI component you created in MATLAB.Add an event listener within the
setupfunction. The event listener listens for"click"events on the button and creates a listener callback function. When a user clicks the Next button, the listener callback function updates the progress bar and sets theDataproperty of thehtmlComponentto the new progress value.
<!DOCTYPE html>
<html>
<head>
<style>
body {
    text-align: center;
}
button {
    width: 43px;
    height: 20px;
}
progress {
    width: 90%;
    height: 20px;
}
</style>

<script type="text/javascript">
    function setup(htmlComponent) {
        let btn = document.getElementById("nextButton");
        htmlComponent.Data = 0;
        btn.addEventListener("click", function(event) {
            let progress = htmlComponent.Data;
            progress = Math.min(progress+25,100);
            document.getElementById("progressBar").value = progress;
            htmlComponent.Data = progress;
        });
    }
</script>
</head>

<body>
    <button id="nextButton">Next</button>
    <br>
    <progress id="progressBar" value="0" max="100"></progress>
</body>
</html>
In MATLAB, set the value of the HTMLSource property to the path
of the HTML file. Create a DataChangedFcn callback function that
displays the updated progress whenever the Data property
changes.
h.HTMLSource = "progressBar.html";
h.DataChangedFcn = @(src,event)disp(event.Data);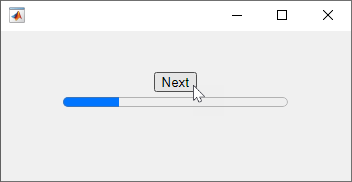
Click the Next button to update the progress bar
and change the Data property. The progress displays in the
MATLAB Command Window.
Since R2023a
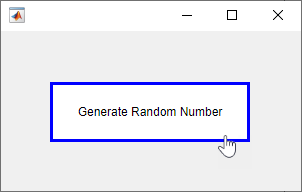
Create a JavaScript
htmlComponent object that generates a random number when a user clicks
a button, and display the number in MATLAB.
First, create a new script named myRandomNum.m. In the script,
create an empty HTML UI component and position it within a figure.
fig = uifigure("Position",[100 100 300 160]);
h = uihtml(fig,"Position",[50 50 200 60]);
Then, create an HTML file named generateJSRandomNumber.html. In
the file:
Use a
<style>tag to define internal CSS styles for a button element.Write a
setupfunction inside of a<script>tag to connect your JavaScript object, namedhtmlComponent, to the HTML UI component you created in MATLAB.Add an event listener within the
setupfunction that listens for"click"events on the button. When a user clicks the button, first generate a random number, and then send an event to notify MATLAB of the click. Pass in the random number as event data so that you can access the number in MATLAB.
<!DOCTYPE html>
<html>
<head>
<style>
body {
  height: 100%;
  text-align: center
}

button {
  width: 100%;
  height: 100%;
  background-color: white;
  color: black;
  border: 3px solid blue;
  font-size: 12px;
  cursor: pointer;
}
</style>

<script type="text/javascript">
   function setup(htmlComponent) {
       let button = document.getElementById("Button");
       button.addEventListener("click", function(event) {
           let num = Math.floor(Math.random() * 100) + 1;
           htmlComponent.sendEventToMATLAB("ButtonClicked",num);
       });
   }
</script>
</head>

<body>
   <button id="Button">Generate Random Number</button>
</body>
</html>
In MATLAB, in the myRandomNum.m script, set the value of the
HTMLSource property to the path of the HTML file. Create an
HTMLEventReceivedFcn callback function that displays the generated
random number in the Command Window.
h.HTMLSource = "generateJSRandomNumber.html";
h.HTMLEventReceivedFcn = @displayNumber;

function displayNumber(src,event)
name = event.HTMLEventName;
if strcmp(name,'ButtonClicked')
    number = event.HTMLEventData;
    disp(number);
end
end
Run the script and click the button to generate and display the random number in the MATLAB Command Window.
Since R2023a
Create a JavaScript
htmlComponent object that updates HTML element styling when a user
interacts with a MATLAB knob component.
First, create a new script named myTemperature.m. In the script,
create a knob UI component and an empty HTML UI component in a UI figure.
fig = uifigure;
k = uiknob(fig,"discrete", ...
    "Items",["Freezing","Cold","Warm","Hot"], ...
    "ItemsData",[0 1 2 3], ...
    "Value",0);
h = uihtml(fig,"Position",[230 60 40 150]);
Then, create an HTML file named thermometer.html. In the
file:
Use a
<style>tag to define internal CSS styles for the parts of a thermometer.Write a
setupfunction inside of a<script>tag to connect your JavaScript object, namedhtmlComponent, to the HTML UI component you created in MATLAB.Add an event listener within the
setupfunction that listens for events from MATLAB named"TemperatureChanged". When thehtmlComponentobject is notified that the temperature has changed, query the event data to get the new temperature. Then, adjust the styling on the thermometer to reflect the new temperature.
<!DOCTYPE html>
<html>
<head>
<style>
.bulb {
    width: 30px;
    height: 30px;
    border: 2px solid;
    border-radius: 50%;
    background-color: red;
}

.stem {
    width: 10px;
    height: 30px;
    border-top: 2px solid;
    border-left: 2px solid;
    border-right: 2px solid;
    position: relative;
    left: 10px;
    top: 4px;
    background-color: white;
}

.stem.hot {
    background-color: red;
}
</style>

<script type="text/javascript">
    function setup(htmlComponent) {
        htmlComponent.addEventListener("TemperatureChanged", function(event) {
            let stem1 = document.getElementById("Stem1");
            let stem2 = document.getElementById("Stem2");
            let stem3 = document.getElementById("Stem3");
            (event.Data > 0) ? stem1.classList.add("hot") : stem1.classList.remove("hot");
            (event.Data > 1) ? stem2.classList.add("hot") : stem2.classList.remove("hot");
            (event.Data > 2) ? stem3.classList.add("hot") : stem3.classList.remove("hot");
        });
    }
</script>
</head>

<body>
    <div id="Stem3" class="stem"></div>
    <div id="Stem2" class="stem"></div>
    <div id="Stem1" class="stem"></div>
    <div id="Bulb" class="bulb"></div>
</body>
</html>
In MATLAB, in the script, write code to communicate with the HTML source:
Set the value of the
HTMLSourceproperty of the HTML UI component to the path of the HTML file.Write a
ValueChangedFcncallback function for the knob that sends an event named"TemperatureChanged"to the HTML source when the temperature changes. Pass the new temperature value as event data.
h.HTMLSource = "thermometer.html";
k.ValueChangedFcn = @(src,event) handleKnobValueChanged(src,event,h);

function handleKnobValueChanged(src,event,h)
val = src.Value;
sendEventToHTMLSource(h,"TemperatureChanged",val);
end
Run the script and interact with the knob to update the thermometer.

Create an HTML UI component that displays data with multiple fields.
Create an item card component that lists an item name, price, and quantity. Design the HTML UI component to take in the item data as a struct in MATLAB. First, check how struct data is encoded when the data is transferred from MATLAB to JavaScript by using the jsonencode function.
matlabData = struct("ItemName","Apple","Price",2,"Quantity",10);
jsonencode(matlabData)
ans =
'{"ItemName":"Apple","Price":2,"Quantity":10}'
For more information about how HTML components transfer data between MATLAB and JavaScript, see Create HTML Content in Apps.
Next, create an HTML source file called itemCard.html that creates and styles the item card HTML component. In the file:
Use a
<style>tag to define internal CSS styles for an item card.Write a
setupfunction inside of a<script>tag to detect when theDataproperty of the MATLAB HTML UI component object changes, and then access theDataproperty of the JavaScripthtmlComponentobject. The data is encoded as a JavaScript object with multiple properties. Access these properties to update the content of the HTML component.Use a
<body>tag to create the main HTML document content.
<!DOCTYPE html>
<html>
<head>
<style>
    table {
        border: 2px solid;
        border-spacing: 0;
        text-align: center;
        position: absolute;
        width: 100%;
        height: 100%;
        margin: 0px;
        padding: 0px;
    }
    th {
        background-color: #097A7A;
        color: black;
        font-size: 24px;
        height: 40%;
    }
    tr {
        background-color: #98D6D6;
        color: gray;
        height: 30%;
    }
    td {
        padding: 5px;
    }
</style>

<script type="text/javascript">
    function setup(htmlComponent) {
        htmlComponent.addEventListener("DataChanged", function(event) {
            let table = document.getElementById("itemCard");
            table.rows[0].cells[0].innerHTML = htmlComponent.Data.ItemName;
            table.rows[1].cells[1].innerHTML = htmlComponent.Data.Price;
            table.rows[2].cells[1].innerHTML = htmlComponent.Data.Quantity;
        });
    }
</script>
</head>

<body>
    <div>
	<table id="itemCard">
            <tr>
                <th colspan="2">Item</th>
            </tr>
            <tr>
                <td>Price:</td>
                <td></td>
            </tr>
            <tr>
                <td>Quantity:</td>
                <td></td>
            </tr>
        </table>
    </div>
</body>
</html>
Create an HTML component in a UI figure. Specify itemCard.html as the HTML source and an item data struct as the component data.
itemData = struct("ItemName","Apple","Price",2,"Quantity",10);
fig = uifigure;
c = uihtml(fig,"HTMLSource","itemCard.html","Data",itemData);

Input Arguments
Name-Value Arguments
Limitations
You cannot link to URL web resources or embed applications from external web pages using the
uihtmlfunction.HTML files that you specify for the
HTMLSourceproperty cannot access third-party JavaScript libraries by way of a Content Delivery Network (CDN). Save libraries in a location that your local file system can access.Common web file types, like JavaScript and CSS, can be referenced from the HTML file you specify for the
HTMLSourceproperty, but other web file types might not be supported.Any supporting files that your component code uses must be in the folder that contains the HTML file you specify for the
HTMLSourceproperty or in a subfolder of that folder.Content cannot overflow the bounds of the HTML UI component. If you are creating dynamic content, like pop-up widgets, make the size of your HTML UI component large enough to display the widget when the pop-up is in its opened state.
On MATLAB Desktop, certain HTML features, such as web plugins and access to webcams or microphones, are not supported.
You cannot set the
HTMLSourceproperty to an HTML file that has query parameters appended to its filename. As a workaround, set these parameters inhtmlComponent.Data.Hyperlinks with
matlab:operations are not supported.UI figure callbacks such as
WindowButtonDownFcnandWindowKeyPressFcndo not execute when an HTML UI component in the figure has focus.
More About
Tips
If you are creating an HTML file to embed in your app, first verify that the static HTML renders properly in a browser. For more information, see Create HTML Content in Apps.
If you want to refresh the value of the
HTMLSourceproperty, use this workaround to save the original value ofHTMLSourceto a variable, resetHTMLSourceto an empty value and update the figure to clear its contents, and finally setHTMLSourceback to its original value.oldValue = h.HTMLSource; h.HTMLSource = ''; drawnow h.HTMLSource = oldValue;To use
uihtmlto display content in a supporting file, such as an image or video, put the file in a location that your local file system can access, reference it in an HTML file that includes the local content, and then set theHTMLSourceproperty to the HTML file.MATLAB figures created with the
uifigurefunction use the Chromium browser and run HTML5. New Chromium versions are released frequently and can vary between operating systems. Consult external Chromium resources for supported features and functionality. Take this factor into consideration if you plan to share your app or use it in different environments.Check external resources, like https://caniuse.com/, for the types of features that are supported across different desktop and web browsers.
MathWorks® does not promote any third-party libraries.