plot
Class: matlab.buildtool.Plan
Namespace: matlab.buildtool
Description
plot( plots the tasks in the plan as a
dependency graph where nodes represent tasks and edges represent dependencies. Edges in the
graph flow from dependent tasks to depended-on tasks. plan)
The plot visualizes the plan as a directed acyclic graph. It cannot contain any cycles.
plot(
specifies whether to show the tasks in task groups. If plan,ShowAllTasks=tf)tf is
true, then the method includes the contents of task groups in the task
graph. For more information about task groups, see Create Groups of Similar Tasks. (since R2024b)
Input Arguments
Examples
Plot the tasks in a build plan as a dependency graph.
Open the example and then navigate to the plot_plan_example folder, which contains a build file as well as two C source files named explore.c and yprime.c.
cd plot_plan_exampleThis code shows the contents of the build file:
The
"clean"task deletes outputs and traces of the other tasks in the build file.The
"mex"task group contains two tasks named"mex:explore"and"mex:yprime". Each of these tasks compiles a source file into a MEX file and saves the result to a folder namedoutputin your current folder. You must have a supported C compiler installed on your system to run the"mex"task group.The
"archive"task creates an archive of its inputs.
function plan = buildfile
import matlab.buildtool.tasks.CleanTask
import matlab.buildtool.tasks.MexTask

% Create a plan from task functions
plan = buildplan(localfunctions);

% Add a task to delete outputs and traces
plan("clean") = CleanTask;

% Add a task group to build MEX files
plan("mex:explore") = MexTask("explore.c","output");
plan("mex:yprime") = MexTask("yprime.c","output");

plan("mex").Description = "Build MEX files";

% Specify the inputs and outputs of the "archive" task
plan("archive").Inputs = [plan("mex").Tasks.MexFile];
plan("archive").Outputs = "mex.zip";
end

function archiveTask(context)
% Create ZIP file
task = context.Task;
zip(task.Outputs.paths,task.Inputs.paths)
end
Load a plan from the build file.
plan = buildfile
plan =
  Plan with tasks:

    archive - Create ZIP file
    clean   - Delete task outputs and traces
    mex     - Build MEX files

  Show all tasks
Plot the tasks in the plan as a dependency graph. The graph displays the "clean" task, "mex" task group, and "archive" task as nodes. However, it does not include the tasks in the "mex" task group. Because the inputs of the "archive" task are the outputs of the "mex" task group, the graph also includes an edge to represent this dependency.
plot(plan)

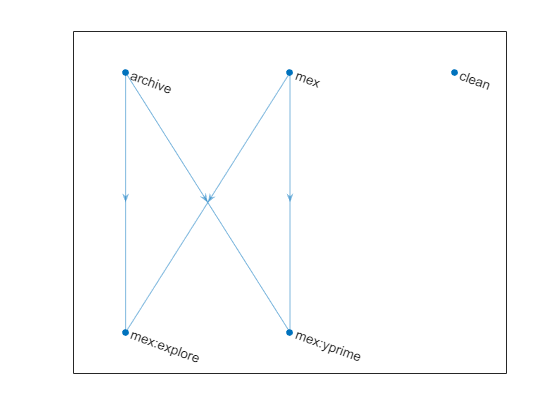
Plot all the tasks in the plan, including the "mex:explore" and "mex:yprime" tasks in the "mex" task group.
plot(plan,ShowAllTasks=true)