plot
Plot alpha shape
Description
plot( uses additional
options specified by one or more shp,Name,Value)Name,Value pair arguments. For a
complete list of allowed Name,Value pairs, see Patch Properties.
h = plot(___)Patch object using any of the previous
syntaxes.
Examples
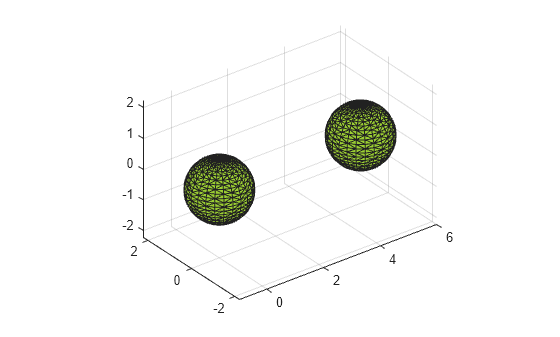
Create a set of 3-D points.
[x1,y1,z1] = sphere(24);
x1 = x1(:);
y1 = y1(:);
z1 = z1(:);
x2 = x1 + 5;
P = [x1 y1 z1; x2 y1 z1];
P = unique(P,"rows");
Create and plot an alpha shape using an alpha radius of 1.5.
shp = alphaShape(P,1.5);
plot(shp)
Plot the alpha shape with a specified color and transparency factor.
plot(shp,FaceColor="red",FaceAlpha=0.1)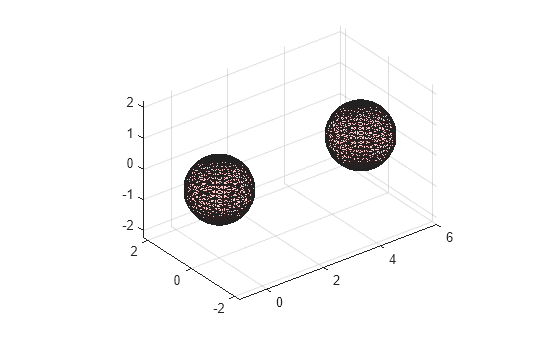
Input Arguments
Output Arguments
Version History
Introduced in R2014b