Optimization Solver Plot Functions
What Is a Plot Function?
The PlotFcns field of an options structure specifies one or more functions that an optimization function calls at each iteration to plot various measures of progress. Pass a function handle or cell array of function handles.
You can use the PlotFcns option with the following MATLAB optimization functions:
fminbndfminsearchfzero
The predefined plot functions for these optimization functions are:
@optimplotxplots the current point@optimplotfvalplots the function value@optimplotfunccountplots the function count (not available forfzero)
Example: Use Built-In Plot Function
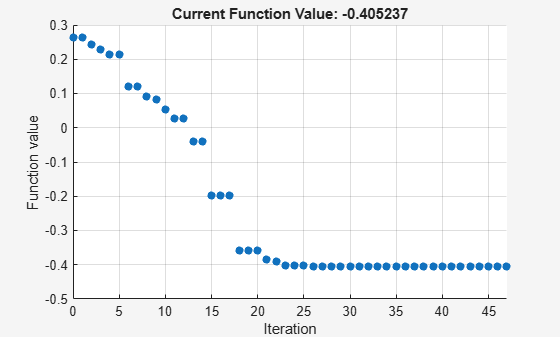
View the progress of a minimization using fminsearch with the plot function @optimplotfval.
The objective function onehump appears at the end of this example.
Set options to use the @optimplotfval plot function.
options = optimset('PlotFcns',@optimplotfval);Call fminsearch starting from the point x0 = [2,1].
x0 = [2 1];
[x fval] = fminsearch(@onehump,x0,options)
x = 1×2

   -0.6691    0.0000
fval =
-0.4052
Example: Use Custom Plot Function
You can write a custom plot function using the same syntax as an output function. For more information on this structure, see Optimization Solver Output Functions.
Create a 2-D plot function that shows the iterative points labeled with the iteration number. For the code, see the myplot helper function at the end of this example. Have the plot function call both the original @optimplotfval plot function as well as myplot.
options.PlotFcns = {@myplot @optimplotfval};
[x fval] = fminsearch(@onehump,x0,options)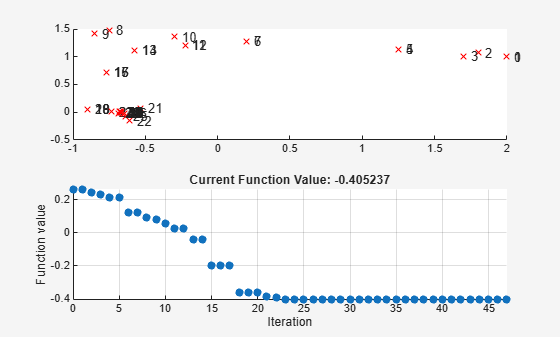
x = 1×2

   -0.6691    0.0000
fval =
-0.4052
The custom plot function plots roughly the last half of the iterations over each other as the solver converges to the final point [-0.6691 0.0000]. This makes the last half of the iterations hard to read. Nevertheless, the plot gives some indication of how fminsearch iterates toward the minimizing point.
Helper Functions
This code creates the onehump helper function.
function f = onehump(x)

r = x(1)^2 + x(2)^2;
s = exp(-r);
f = x(1)*s+r/20;
end
This code creates the myplot helper function.
function stop = myplot(x,optimValues,state)
stop = false;
switch state
    case 'init'
          % Setup for plots or dialog boxes
          hold on
    case 'iter'
          % Make updates to plots or dialog boxes as needed
          plot(x(1),x(2),'rx');
          text(x(1)+.05,x(2),...
                num2str(optimValues.iteration));
    case 'done'
          % Cleanup of plots, dialog boxes, or final plot
          hold off
end
end