Develop Charts With Polar Axes, Geographic Axes, or Multiple Axes
For charts you develop as a subclass of the ChartContainer base
class, the getAxes
method provides a way to support a single Cartesian axes object. If you want to support
polar axes, geographic axes, or multiple axes, you must create and configure the axes as
children of a TiledChartLayout object, which is stored in the chart
object.
Create a Single Polar or Geographic Axes Object
To include a single polar axes or geographic axes object in your chart:
Define a private property to store the axes.
In the
setupmethod:
For example, here is a basic class that contains a polar axes object.
classdef SimplePolar < matlab.graphics.chartcontainer.ChartContainer
    properties(Access = private,Transient,NonCopyable)
        PolarAx matlab.graphics.axis.PolarAxes
    end

    methods(Access = protected)
        function setup(obj)
            % Get the layout and create the axes
            tcl = getLayout(obj);
            obj.PolarAx = polaraxes(tcl);

            % Other setup code
            % ...
        end
        function update(obj)
            % Update the chart
            % ...
        end
    end
end
Create a Tiling of Multiple Axes Objects
To display a tiling of multiple axes:
Define private properties that store the axes objects. You can also define one property that stores an array of axes objects.
In the
setupmethod:Call the
getLayoutmethod to get theTiledChartLayoutobject.Set the
GridSizeproperty of theTiledChartLayoutobject so that it has at least one tile for each of the axes.Call the
axes,polaraxes, orgeoaxesfunction to create the axes objects, and specify theTiledChartLayoutobject as the parent object.Move each of the axes to the desired tile by setting the
Layoutproperty on each axes object. By default, the axes appear in the first tile.
For example, here is a basic class that contains two Cartesian axes:
classdef TwoAxesChart < matlab.graphics.chartcontainer.ChartContainer
    properties(Access = private,Transient,NonCopyable)
        Ax1 matlab.graphics.axis.Axes
        Ax2 matlab.graphics.axis.Axes
    end

    methods(Access = protected)
        function setup(obj)
            % Get the layout and set the grid size
            tcl = getLayout(obj);
            tcl.GridSize = [2 1];

            % Create the axes
            obj.Ax1 = axes(tcl);
            obj.Ax2 = axes(tcl);

            % Move the second axes to the second tile
            obj.Ax2.Layout.Tile = 2;
        end
        function update(obj)
            % Update the chart
            % ...
        end
    end
end
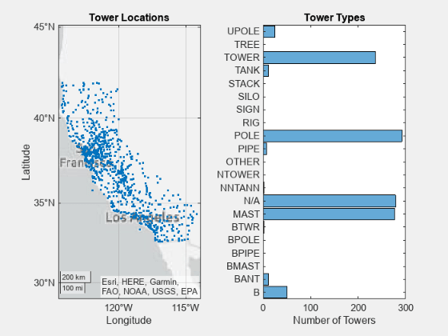
Example: Chart Containing Geographic and Cartesian Axes
This example shows how to define a class of charts for visualizing geographic and categorical data using two axes. The left axes contains a map showing the locations of several cellular towers. The right axes shows the distribution of the towers by category.
The following TowerChart class definition shows how to:
Define a public property called
TowerDatathat stores a table.Validate the contents of the table using a local function called
mustHaveRequiredVariables.Define two private properties called
MapAxesandHistogramAxesthat store the axes.Implement a
setupmethod that gets theTiledChartLayoutobject, specifies the grid size of the layout, and positions the axes.
To define the class, copy this code into the editor and save it with the name TowerChart.m in a writable folder.
classdef TowerChart < matlab.graphics.chartcontainer.ChartContainer
    properties
        TowerData (:,:) table {mustHaveRequiredVariables} = table([],...
            [],[],'VariableNames',{'STRUCTYPE','Latitude','Longitude'})
    end

    properties (Access = private,Transient,NonCopyable)
        MapAxes matlab.graphics.axis.GeographicAxes
        HistogramAxes matlab.graphics.axis.Axes
        ScatterObject matlab.graphics.chart.primitive.Scatter
        HistogramObject matlab.graphics.chart.primitive.categorical.Histogram
    end

    methods (Access = protected)
        function setup(obj)
            % Configure layout and create axes
            tcl = getLayout(obj);
            tcl.GridSize = [1 2];
            obj.MapAxes = geoaxes(tcl);
            obj.HistogramAxes = axes(tcl);

            % Move histogram axes to second tile
            obj.HistogramAxes.Layout.Tile = 2;

            % Create Scatter and Histogram objects
            obj.ScatterObject = geoscatter(obj.MapAxes,NaN,NaN,'.');
            obj.HistogramObject = histogram(obj.HistogramAxes,categorical.empty,...
                'Orientation','horizontal');

            % Add titles to the axes
            title(obj.MapAxes,"Tower Locations")
            title(obj.HistogramAxes,"Tower Types")
            xlabel(obj.HistogramAxes,"Number of Towers")
        end

        function update(obj)
            % Update Scatter object
            obj.ScatterObject.LatitudeData = obj.TowerData.Latitude;
            obj.ScatterObject.LongitudeData = obj.TowerData.Longitude;

            % Get tower types from STRUCTYPE table variable
            towertypes = obj.TowerData.STRUCTYPE;

            % Check for empty towertypes before updating histogram
            if ~isempty(towertypes)
                obj.HistogramObject.Data = towertypes;
                obj.HistogramObject.Categories = categories(towertypes);
            else
                obj.HistogramObject.Data = categorical.empty;
            end
        end
    end
end

function mustHaveRequiredVariables(tbl)
% Return error if table does not have required variables
assert(all(ismember({'STRUCTYPE','Latitude','Longitude'},...
    tbl.Properties.VariableNames)),...
    'MATLAB:TowerChart:InvalidTable',...
    'Table must have STRUCTYPE, Latitude, and Longitude variables.');
end
After saving the class file, load the table stored in cellularTowers.mat. Then create an instance of the chart by passing the table to the TowerChart constructor method as a name-value pair argument.
load cellularTowers.mat
TowerChart('TowerData',cellularTowers);