Main Content

getLayout

Class: matlab.graphics.chartcontainer.ChartContainer
Namespace: matlab.graphics.chartcontainer

Get tiled chart layout for chart container subclass

Since R2020a

Syntax

tcl = getLayout(obj)

Description

tcl = getLayout(obj) returns the tiled chart layout for a chart object that inherits from the matlab.graphics.chartcontainer.ChartContainer base class.

Input Arguments

expand all

Object of the class that inherits from the matlab.graphics.chartcontainer.ChartContainer base class.

Output Arguments

expand all

TiledChartLayout object. Use tcl when you are developing a chart that contains a polar plot, a geographic plot, or a tiling of multiple plots. You can configure certain aspects of the layout, such as the number of tiles, the location of each axes object, and the spacing between the tiles.

Attributes

Protectedtrue

To learn about attributes of methods, see Method Attributes.

Examples

expand all

Define a class called CartPolarPlot that plots data in Cartesian and polar coordinates.

To define the class, create a file called CartPolarPlot.m that contains the following class definition with these features:

  • Three public properties: XData and YData to store the coordinate data, and LineColor to control the color of the lines

  • Four private properties that store the two lines and axes objects

  • A setup method that configures the layout, creates the axes, and initializes the two Line objects

  • An update method that updates the Line objects when the user changes the value of one or more public properties

classdef CartPolarPlot < matlab.graphics.chartcontainer.ChartContainer
    properties
        XData (1,:) double = NaN
        YData (1,:) double = NaN
        LineColor (1,3) double {mustBeGreaterThanOrEqual(LineColor,0),...
            mustBeLessThanOrEqual(LineColor,1)} = [.5 0 1]
    end
    properties(Access = private,Transient,NonCopyable)
        CartesianLine (1,1) matlab.graphics.chart.primitive.Line
        PolarLine (1,1) matlab.graphics.chart.primitive.Line
        CartesianAx (1,1) matlab.graphics.axis.Axes
        PolarAx (1,1) matlab.graphics.axis.PolarAxes
    end
    
    methods(Access = protected)
        function setup(obj)
            % Get the layout and create the axes
            tcl = getLayout(obj);
            tcl.GridSize = [1 2];
            obj.CartesianAx = axes(tcl);
            obj.PolarAx = polaraxes(tcl);
            
            % Move the polar axes to the second tile
            obj.PolarAx.Layout.Tile = 2;
            
            % Create the Cartesian and polar lines
            obj.CartesianLine = plot(obj.CartesianAx,NaN,NaN);
            obj.PolarLine = polarplot(obj.PolarAx,NaN,NaN);
        end
        function update(obj)
            % Update Cartesian line
            obj.CartesianLine.XData = obj.XData;
            obj.CartesianLine.YData = obj.YData;
            obj.CartesianLine.Color = obj.LineColor;
            
            % Update polar line
            obj.PolarLine.Color = obj.LineColor;
            obj.PolarLine.ThetaData = obj.XData;
            obj.PolarLine.RData = obj.YData;
        end
    end
end

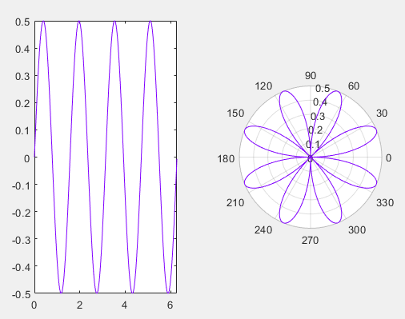
Next, create a set of x- and y-coordinates. Then plot the coordinates by calling the CartPolarPlot constructor method with the 'XData' and 'YData' name-value pair arguments.

x = 0:0.01:2*pi;
y = sin(2*x).*cos(2*x);
CartPolarPlot('XData',x,'YData',y);

Version History

Introduced in R2020a