Use Basemaps in Offline Environments
Provide geographic context for your maps by displaying data over a
basemap, also called a base layer. MathWorks® provides a variety of basemaps, including low-resolution two-tone options
created using Natural Earth and high-zoom-level options hosted by Esri®. For a list of basemap options, see the basemap argument of the
geobasemap function.
Most of these basemaps require internet access, including the default basemap. If you do
not have reliable access to the internet, you can use strategies such as downloading a
selection of basemaps onto your local system or displaying data over the
"darkwater" basemap. Some strategies require MATLAB® to have temporary internet access and other strategies do not require
MATLAB to have internet access. Different strategies support different types of map
displays.
| Internet Access Requirement for MATLAB | Strategy | Supported Map Displays |
|---|---|---|
| Temporary Internet Access | Download Basemaps Onto Your Local System |
|
| Use Cached Basemap Tiles |
| |
| Use Image from Web Source |
| |
| No Internet Access | Create Basemap from MBTiles File |
|
| Create Basemap from Image |
| |
| Use Basemap Installed with MATLAB |
| |
| Use Image from File |
| |
| Use Vector Data from File |
|
Temporary Internet Access
These strategies require MATLAB to temporarily access the internet. When MATLAB is in an online environment, you can save the basemap data to your local system. Then, when MATLAB is in an offline environment, you can load the saved basemap data.
Download Basemaps Onto Your Local System
When you have internet access, you can download the basemaps created using Natural Earth onto your local system. The basemaps hosted by Esri are not available for download. Then, when you are in an offline environment, you can use the downloaded basemaps.
Download basemaps using the Add-On Explorer.
On the MATLAB Home tab, in the Environment section, click Add-Ons and then Explore Add-Ons.
In the Add-On Explorer, scroll to the MathWorks Optional Features section, and click Show All to find the basemap add-ons. You can also search for the basemap add-ons by name, or click Optional Features in Filter by Type.
Select the basemap add-ons that you want to download.
These are the names of the basemaps and their associated basemap add-ons.
| Basemap Name | Basemap Add-On |
|---|---|
"bluegreen" | MATLAB Basemap Data - bluegreen |
"grayland" | MATLAB Basemap Data - grayland |
"colorterrain" | MATLAB Basemap Data - colorterrain |
"grayterrain" | MATLAB Basemap Data - grayterrain |
"landcover" | MATLAB Basemap Data - landcover |
Use Cached Basemap Tiles
When you view a basemap over the internet, MATLAB temporarily caches the basemap tiles. If you lose your internet connection, you can still view the cached basemap tiles.
When you are in an offline environment and attempt to view basemap tiles that you have
not previously viewed, MATLAB issues a warning and displays different tiles depending on the type of
basemap. When you attempt to view tiles created using Natural Earth, MATLAB displays "darkwater" tiles. When you attempt to view tiles
from a custom basemap or tiles hosted by Esri, you see missing map tiles.
Cached basemap tiles have these limitations:
MATLAB stores the cached tiles in a temporary folder. Your operating system can delete the temporary folder.
The cached tiles can expire.
MATLAB caches custom basemap tiles for only the current MATLAB session.
Use Image from Web Source
When you have internet access, you can read an image from a basemap or a Web Map Service (WMS) server as an image and save the image as a MAT or GeoTIFF file. Then, when you are in an offline environment, you can load the image from the file and use it as a base layer for your data.
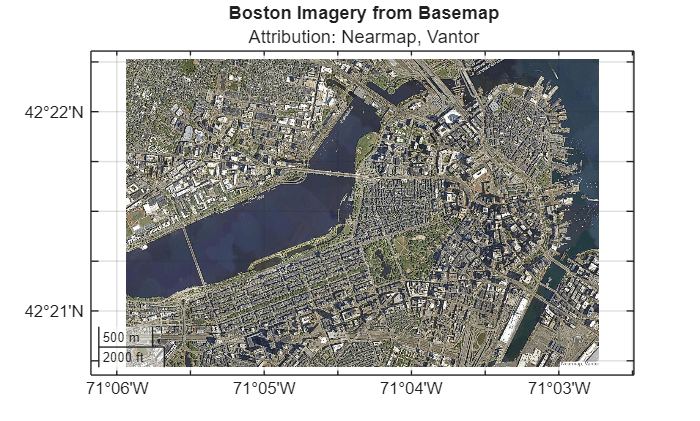
Read and Save Image from Basemap
Read satellite imagery for Boston into the workspace as an array, a raster reference object, and an attribution by using the readBasemapImage function.
[A1,R1,attrib1] = readBasemapImage("satellite",[42.3453 42.3711],[-71.099 -71.0454]);Save the imagery as a GeoTIFF file by using the geotiffwrite function.
The
readBasemapImagefunction references the image using the Web Mercator projected coordinate reference system (CRS) with EPSG code3857. Specify the CRS code by using theCoordRefSysCodename-value argument.Include the attribution by specifying the
ImageDescriptionTIFF tag.
tag = struct("ImageDescription",attrib1);
geotiffwrite("satelliteBoston.tif",A1,R1,CoordRefSysCode=3857,TiffTags=tag)
To use the basemap data, load the GeoTIFF file and attribution.
[A2,R2] = readgeoraster("satelliteBoston.tif");
info = imfinfo("satelliteBoston.tif");
attrib2 = info.ImageDescription;
Display the data using a map axes and the projected CRS stored in the reference object.
figure
pcrs2 = R2.ProjectedCRS;
newmap(pcrs2)
geoimage(A2,R2)
title("Boston Imagery from Basemap")
subtitle("Attribution: " + attrib2)
For more information about displaying data over basemaps images in offline environments, see Display Data over Basemaps When Internet Access Is Intermittent.
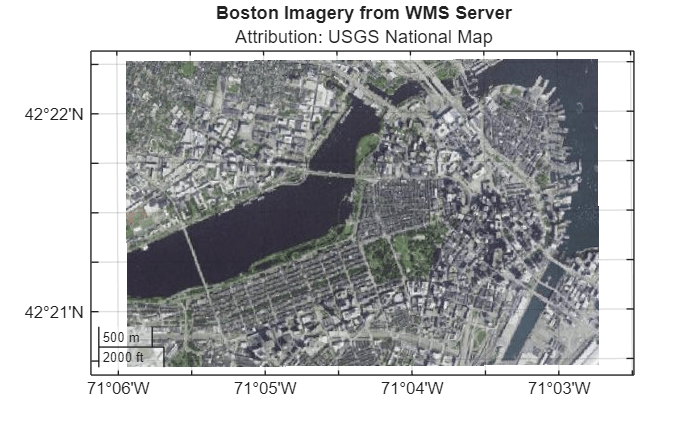
Read and Save Image from WMS Server
WMS servers provide publicly accessible geospatial data from web-based sources. Search the WMS Database for orthoimagery from the USGS National Map.
usgs = wmsfind("basemap.nationalmap",SearchFields="ServerURL");
imagery = refine(usgs,"USGSImageryOnly",SearchFields="ServerURL");
imagery = wmsupdate(imagery);
Read orthoimagery for an area in Boston by using the wmsread function. Then, save the imagery as a GeoTIFF file.
[A3,R3] = wmsread(imagery,Latlim=[42.3453 42.3711],Lonlim=[-71.099 -71.0454]);
geotiffwrite("usgsImageryLayer.tif",A3,R3)
To use the WMS orthoimagery, load the GeoTIFF file. Then, display the data using a map axes and a projected CRS that is appropriate for the region.
[A4,R4] = readgeoraster("usgsImageryLayer.tif");

figure
pcrs4 = projcrs(26986);
newmap(pcrs4)
geoimage(A4,R4)
title("Boston Imagery from WMS Server")
subtitle("Attribution: USGS National Map")
For more information about creating WMS maps in offline environments, see Create WMS Maps When Internet Access Is Intermittent.
No Internet Access
These strategies do not require MATLAB to access the internet.
Create Basemap from MBTiles File
When you are in an offline environment, you can use the addCustomBasemap function to create a custom basemap from an MBTiles file.
MBTiles files can contain raster or vector map tiles. If you do not know whether your MBTiles file contains raster or vector map tiles, check with your data provider.
Raster map tiles are useful for displaying satellite imagery and orthoimagery. You can write raster data to an MBTiles file by using the
mbtileswritefunction.Vector map tiles enable you to customize the appearance of the basemap and typically include higher zoom levels than raster map tiles. For information about customizing the appearance of vector basemaps, see Customize Appearance of Vector Basemaps.
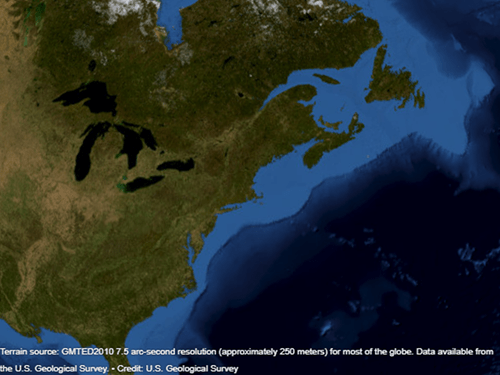
Create Basemap from Raster MBTiles File
Mapping Toolbox™ includes a raster MBTiles file with low-resolution USGS imagery called usgsimagery.mbtiles. Create a custom basemap from the file and display it using a geographic globe. Position the camera 3200 kilometers above Boston.
addCustomBasemap("usgsimagery","usgsimagery.mbtiles")

uif = uifigure;
g = geoglobe(uif);
geobasemap(g,"usgsimagery")
campos(g,42.3582,-71.0722,3200000)
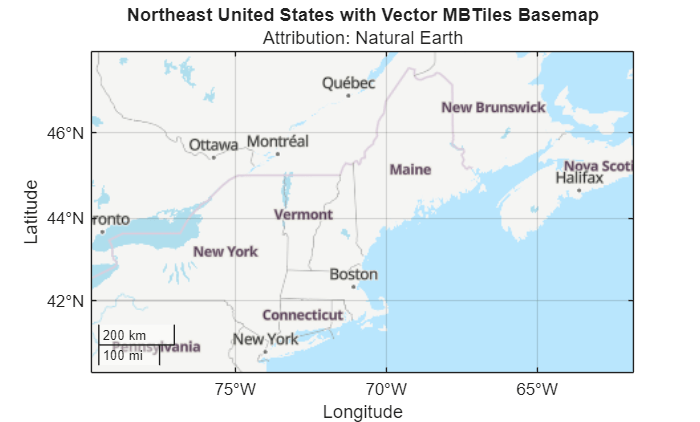
Create Basemap from Vector MBTiles File
Mapping Toolbox includes a vector MBTiles file, naturalearth.mbtiles, with low-zoom levels of region and land boundaries. Create a custom basemap from the file. Specify the appearance of the basemap, including the colors and fonts, using a predefined topographic style. Predefined styles do not require internet access. For information about vector basemap styles, including limitations in offline environments, see the Style argument on the addCustomBasemap reference page.
addCustomBasemap("naturalearth","naturalearth.mbtiles",Style="topographic")
Display the custom basemap using a geographic axes.
figure
geobasemap naturalearth
geolimits([40.1951 47.8433],[-77.5238 -64.0377])
title("Northeast United States with Vector MBTiles Basemap")
subtitle("Attribution: Natural Earth")
Create Basemap from Image
When you are in an offline environment, you can use the addCustomBasemap function to create a custom basemap from an image. The function you use to read the image into the workspace depends on the file format.
Read images in formats such as GeoTIFF by using the
readgeorasterfunction.Read images in formats that are associated with a world file, such as TIFF, JPEG, or PNG, by using the
imreadandworldfilereadfunctions.
Read a GeoTIFF image of Boston into the workspace as an array and a map cells reference object. The array is a grid of cells referenced to projected coordinates.
[A5,R5] = readgeoraster("boston.tif");Add a custom basemap from the array and reference object. The addCustomBasemap function issues a warning because the array and reference object do not specify global data for zoom level 0.
addCustomBasemap("bostonBasemap",A5,R5)Warning: Basemap contains regional data with latitude limits in the range [42.3451, 42.3713] and longitude limits in the range [-71.0999, -71.0454]. Global map displays might show missing tiles.
Display the custom basemap using a geographic axes. MATLAB sets the limits of the axes to closely match the limits of the basemap data. The black background indicates areas where the basemap tile contains no data.
figure
geobasemap bostonBasemap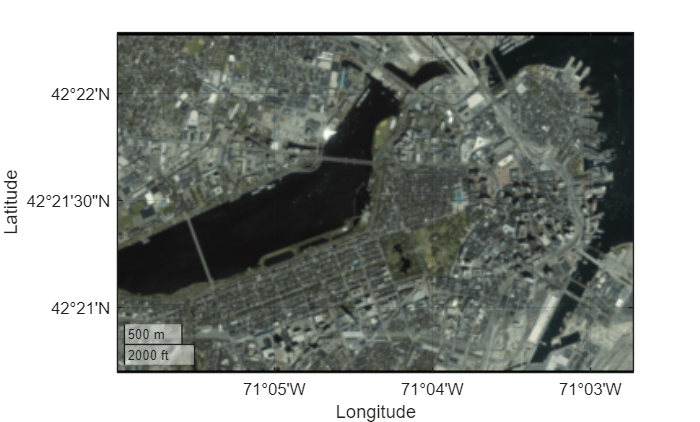
Use Basemap Installed with MATLAB
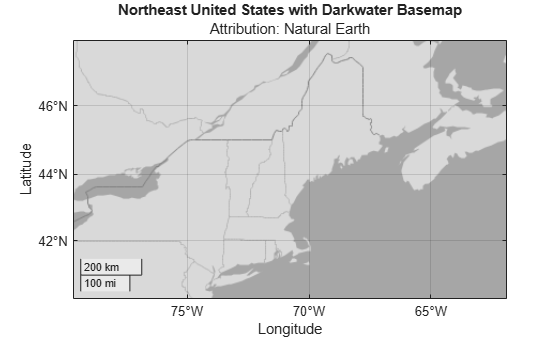
MATLAB includes the "darkwater" basemap, a two-tone land-ocean map with light gray land areas and dark gray water areas. Using the "darkwater" basemap does not require internet access.
Display the "darkwater" basemap using a geographic axes. Center the map over the northeast United States.
figure
geobasemap darkwater
geolimits([40.1951 47.8433],[-77.5238 -64.0377])
title("Northeast United States with Darkwater Basemap")
subtitle("Attribution: Natural Earth")
Use Image from File
When you are in an offline environment, you can read an image from a file and then use it as a base layer for your data. The function you use to read the data depends on the file format.
Read images in formats such as GeoTIFF by using the
readgeorasterfunction.Read images in formats that are associated with a world file, such as TIFF, JPEG, or PNG, by using the
imreadandworldfilereadfunctions.
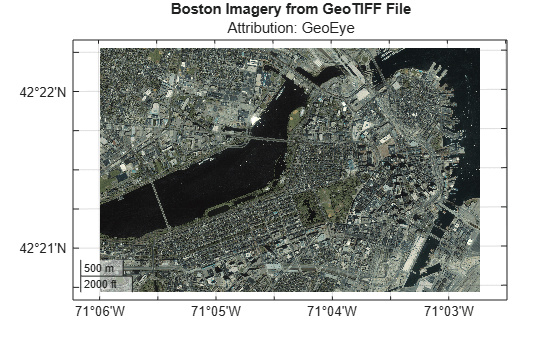
Read a GeoTIFF image of Boston into the workspace as an array and a raster reference object. Then, display the image using a map axes and the projected CRS stored in the reference object.
[A6,R6] = readgeoraster("boston.tif");

figure
pcrs6 = R6.ProjectedCRS;
newmap(pcrs6)
geoimage(A6,R6)
title("Boston Imagery from GeoTIFF File")
subtitle("Attribution: GeoEye")
Use Vector Data from File
When you are in an offline environment, you can read vector data from a file and then use it as a base layer for your data. Read vector data in formats such as shapefile by using the readgeotable function.
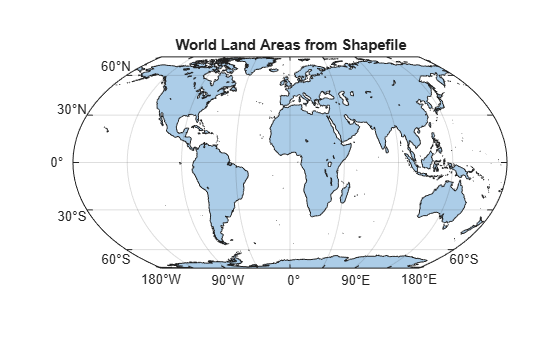
Mapping Toolbox™ includes a shapefile with world land areas called landareas.shp. Read the land areas into the workspace as a geospatial table. Then, display the land areas on a map axes using the default projected CRS.
GT = readgeotable("landareas.shp");

figure
newmap
geoplot(GT)
title("World Land Areas from Shapefile")
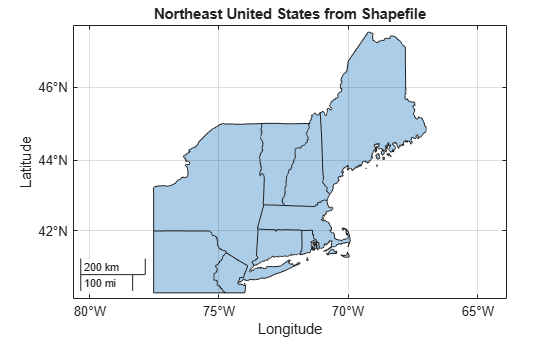
Mapping Toolbox™ includes a shapefile with US state boundaries called usastatehi.shp. Read the shapefile into the workspace as a geospatial table. Clip the boundaries to include only the northeast states.
GT = readgeotable("usastatehi.shp");
ne = geoclip(GT.Shape,[40.1951 47.8433],[-77.5238 -64.0377]);
Display the boundaries using a geographic axes. To prevent MATLAB from using the basemaps provided by MathWorks, set the basemap to "none".
figure
geobasemap none
hold on
geoplot(ne)
title("Northeast United States from Shapefile")
When you display a base layer using the geoplot function, you can exclude the base layer from the automatic calculation of axes limits by setting the AffectAutoLimits property of the graphics object to "off". For an example, see Create Base Layer from OpenStreetMap Data.