worldmap
Create axesm-based map for world region
Description
worldmap or
regionworldmap( sets up an empty
region)axesm-based map (previously referred to as map axes)
with projection and limits suitable to the part of the world specified in
region.
worldmap with no arguments presents a menu from which you
can select the name of a single continent, country, island, or region.
h = worldmap(___)axesm-based map.
Examples
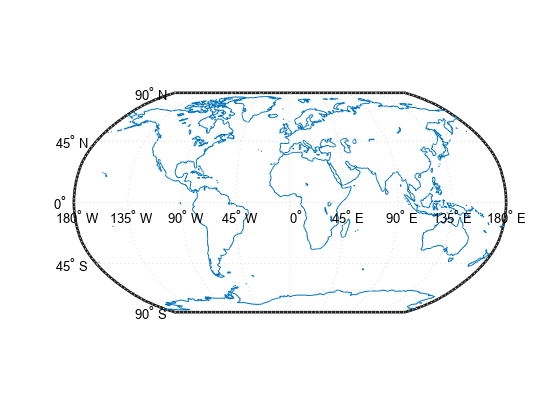
Set up a world map and draw coarse coastlines.
worldmap('World')
load coastlines
plotm(coastlat,coastlon)
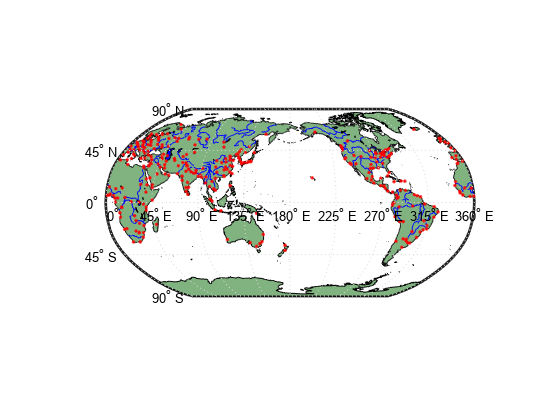
Read and display land areas, major lakes and rivers, cities, and populated places on a world map.
ax = worldmap("World");
setm(ax,"Origin",[0 180 0])

land = readgeotable("landareas.shp");
geoshow(ax,land,"FaceColor",[0.5 0.7 0.5])

lakes = readgeotable("worldlakes.shp");
geoshow(lakes,"FaceColor","blue")

rivers = readgeotable("worldrivers.shp");
geoshow(rivers,"Color","blue")

cities = readgeotable("worldcities.shp");
geoshow(cities,"Marker",".","Color","red")
Geocode the continent of Antarctica. The output is a geospatial table that represents Antarctica using a polygon shape in geographic coordinates.
GT = geocode("Antarctica");Display Antarctica on a map with an appropriate projection.
worldmap("antarctica")
geoshow(GT)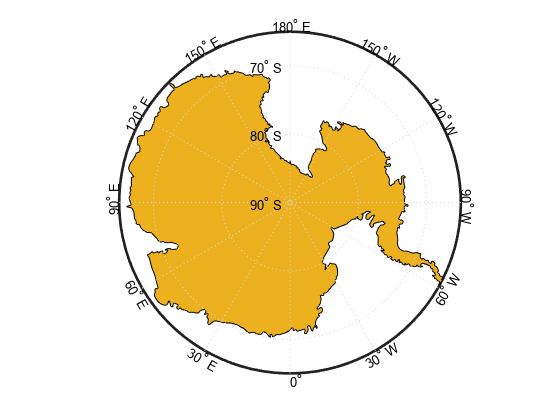
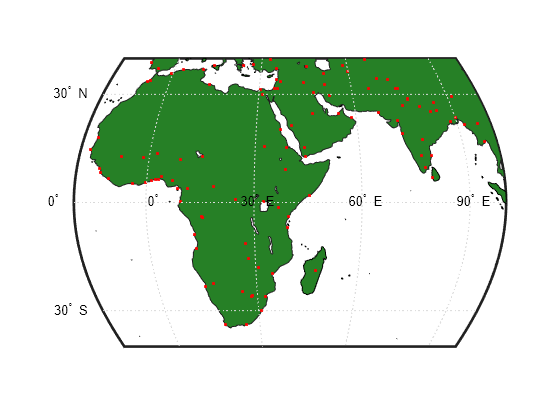
Read world land areas and cities as geospatial tables. Create a world map appropriate for Africa and India. Then, display the land areas and cities on the map
land = readgeotable("landareas.shp");
cities = readgeotable("worldcities.shp");

worldmap(["Africa" "India"])
geoshow(land,"FaceColor",[0.15 0.5 0.15])
geoshow(cities,"Marker",".","Color","red")
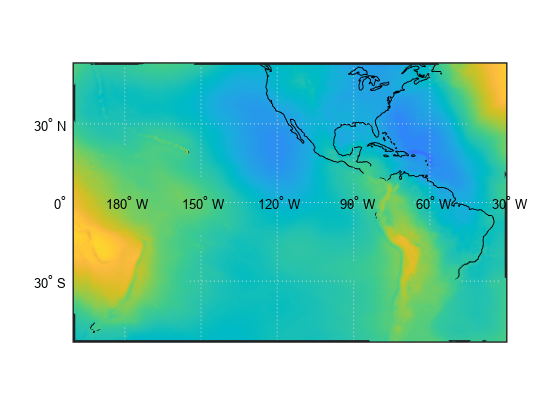
Display geoid heights from the EGM96 geoid model over a map of South America and the central Pacific. First, get geoid heights and a geographic postings reference object. Load coastline latitude and longitude data.
[N,R] = egm96geoid;
load coastlines
Create a world map by specifying latitude and longitude limits. Then, display the geoid heights and coastline data.
latlim = [-50 50];
lonlim = [160 -30];
worldmap(latlim,lonlim)

geoshow(N,R,'DisplayType','surface')
geoshow(coastlat,coastlon,'Color','k')
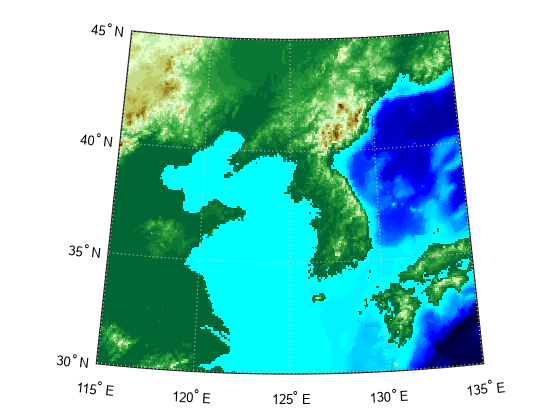
Load elevation data and a geographic cells reference object for the Korean peninsula. Create a world map with appropriate latitude and longitude limits. Then, display the data as a texture map using geoshow. Apply a colormap appropriate for elevation data using demcmap.
load korea5c
worldmap(korea5c,korea5cR);
geoshow(korea5c,korea5cR,'DisplayType','texturemap')
demcmap(korea5c)
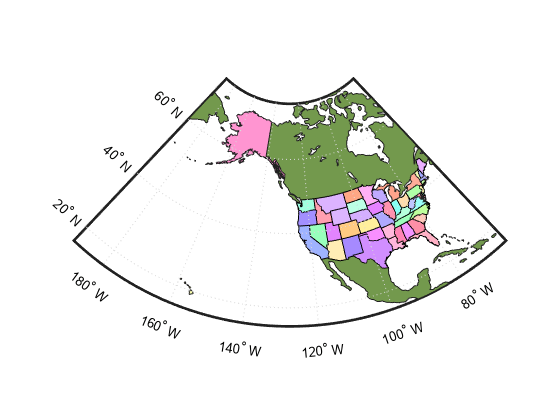
Create a map of the United States of America. Display the states using a palette of random, muted colors.
worldmap("USA");

load coastlines
geoshow(coastlat,coastlon, ...
    "DisplayType","polygon","FaceColor",[0.45 0.60 0.30])

states = readgeotable("usastatelo.shp");

h = height(states);
faceColors = makesymbolspec("Polygon", ...
    {'INDEX',[1 h],'FaceColor',polcmap(h)});

geoshow(states,"DisplayType","polygon", ...
  "SymbolSpec",faceColors)
Input Arguments
Output Arguments
Tips
All axes created with
worldmapare initialized with a spherical Earth model having a radius of 6,371,000 meters.worldmapusestightmapto adjust the axes limits around the map. If you change the projection, or just want more white space around the map frame, usetightmapagain orauto axis.