newmap
R2026bDescription
newmap creates the default map axes in the current figure. By
default, the function creates a world map that uses an Equal Earth projection.
In some cases, the newmap function can change the current figure
and current axes. For more information, see Figure and Axes Selection.
newmap( creates a map for the specified
placename. The function searches for the placename, then selects a projected CRS based on
the size and location of the matched region. Examples of placenames include regions, cities,
and addresses. (since R2026b)placename)
newmap( creates a map for the specified area
of interest (AOI). The function selects a projected CRS based on the size and location of
the AOI. This syntax is useful for creating maps from imported geographic data. (since R2026b)aoi)
newmap( changes or
replaces the axes specified by target,___)target instead of the current axes, in
addition to any combination of inputs from the previous syntaxes.
mx = newmap(___) returns the MapAxes
object. Use mx to query and modify properties of the
MapAxes object after creation. For a list of properties, see MapAxes Properties.
Examples
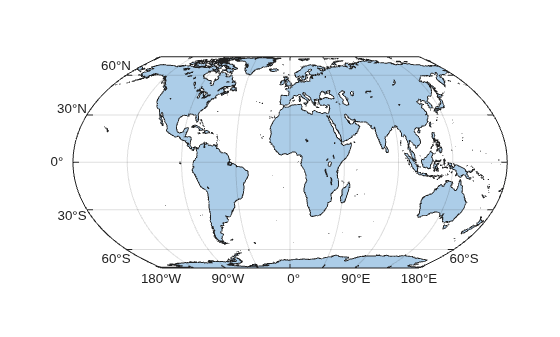
Create the default map axes. By default, the map axes uses an Equal Earth projection.
newmap
Read a shapefile containing world land areas into the workspace as a geospatial table. Display the land areas on the map axes.
land = readgeotable("landareas.shp");
geoplot(land)
To create map axes from a projected CRS, first create a projected CRS object by using the projcrs function. You can create a projected CRS object from an authority code or from a well-known text string.
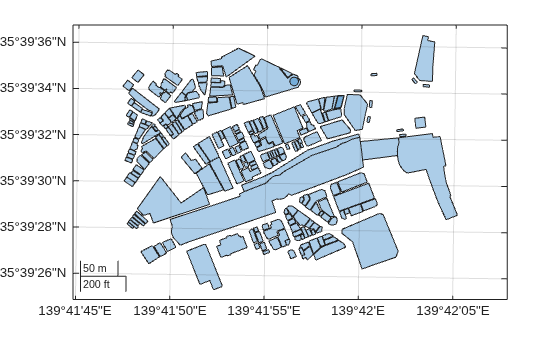
Read buildings data for several city blocks in Shibuya, Tokyo, Japan from an OpenStreetMap® file [1] into the workspace as a geospatial table. The table represents the buildings using polygons in geographic coordinates.
buildings = readgeotable("shibuya.osm",Layer="buildings");
Create a projected CRS object that is appropriate for this region of Japan. Use the WGS 84 / UTM zone 54N projected CRS, which has the EPSG code 32654. Then, create a map axes that uses the projected CRS.
proj = projcrs(32654); newmap(proj)
Display the buildings on the map.
geoplot(buildings)
[1] You can download OpenStreetMap files from https://www.openstreetmap.org, which provides access to crowd-sourced map data all over the world. The data is licensed under the Open Data Commons Open Database License (ODbL), https://opendatacommons.org/licenses/odbl/.
Read an image of world land areas into the workspace as an array and a reference object.
[A,R] = readgeoraster("bluegreen-world.tif");Create a map by specifying the placename "Europe".
newmap("Europe")Display the image on the map.
geoimage(A,R)
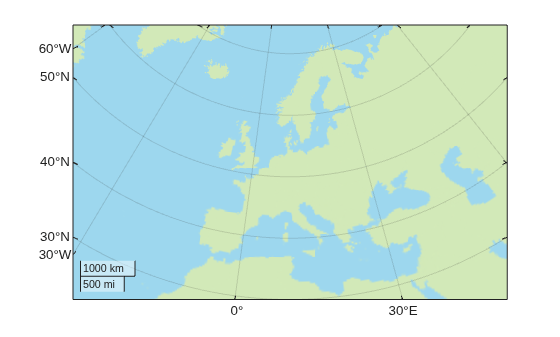
View the projection method selected by the newmap function.
mx = gca; mx.ProjectedCRS.ProjectionMethod
ans = "Equidistant Conic"
When your data uses projected coordinates, you can extract the projected CRS from the data and then create a map from the projected CRS.
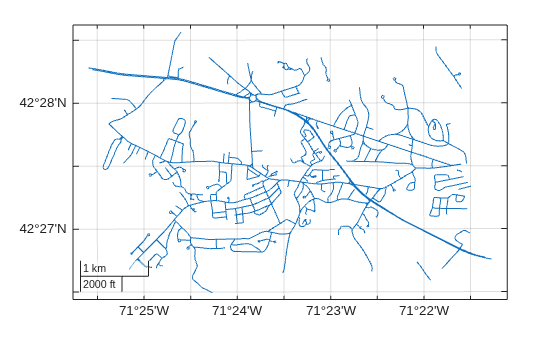
Read a shapefile of road data into the workspace as a geospatial table. The table represents the roads using line shapes in projected coordinates.
roads = readgeotable("concord_roads.shp");Extract the projected CRS from the data file. Then, create a map axes that uses the projected CRS.
proj = roads.Shape.ProjectedCRS; newmap(proj)
Display the data on the map axes.
geoplot(roads)
When your data uses geographic coordinates, you can define an AOI from the data and then create a map from the AOI. The newmap function selects a projected CRS based on the size and location of the AOI.
Read the elevation data [1] into the workspace as an array and a raster reference object in geographic coordinates.
[Z,R] = readgeoraster("n39_w106_3arc_v2.dt1");Create an AOI from the raster reference object. Then, create a map axes from the AOI. The newmap function creates a projected CRS that is appropriate for the AOI.
aoi = aoiquad(R); newmap(aoi)
Display the elevation data on the map. Apply a colormap that is appropriate for elevation data. Add a color bar.
geopcolor(Z,R) demcmap(Z) colorbar
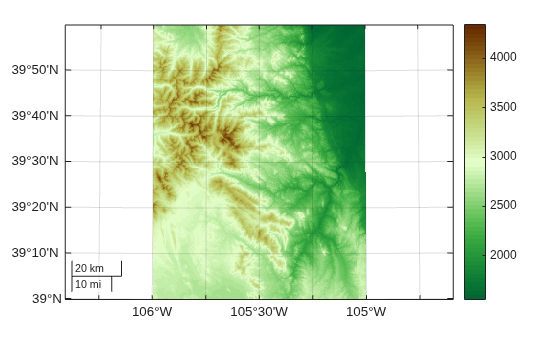
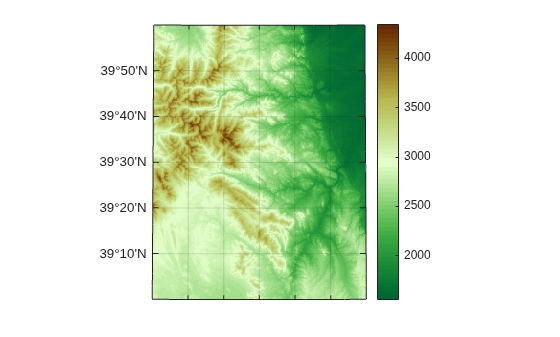
Apply a cartographic map layout, which displays only the data within the CartographicLatitudeLimits and CartographicLongitudeLimits properties of the map axes object. When you create a map from an AOI in geographic coordinates, the cartographic limits match the bounds of the AOI.
mx = gca;
mx.MapLayout = "cartographic";
[1] The elevation data used in this example is from the US Geological Survey.
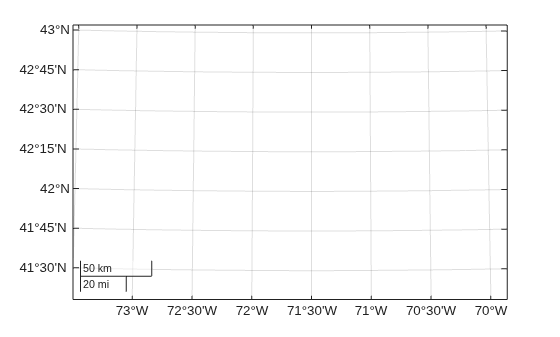
Import a shapefile containing road data for Concord, MA into the workspace as a geospatial table. The table represents roads using line shapes in projected coordinates.
roads = readgeotable("concord_roads.shp");Create a map axes that uses the projected CRS embedded in the data file. Return the MapAxes object as a variable.
proj = roads.Shape.ProjectedCRS; mx = newmap(proj);
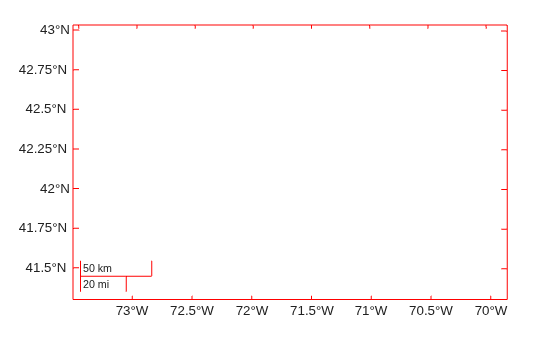
Customize the map by setting properties of the MapAxes object. Set the tick label format to decimal degrees, remove the graticule lines, and change the outline color.
mx.TickLabelFormat = "dd"; mx.GraticuleLineStyle = "none"; mx.OutlineColor = "r";
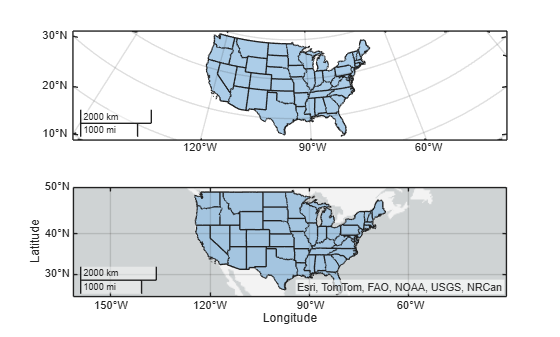
Read a shapefile of US states into the workspace as a geospatial table. Create a table of the conterminous states by removing the rows for Alaska and Hawaii.
states = readgeotable("usastatehi.shp"); idx = states.Name ~= "Alaska" & states.Name ~= "Hawaii"; conus = states(idx,:);
Create a 2-by-1 tiled chart layout.
In the first tile, display the states in a map axes. Use a projection that is appropriate for the conterminous states.
In the second tile, display the states over a geographic axes, which uses a Web Mercator projection.
tiledlayout(2,1)
nexttile
newmap("United States (conterminous)")
geoplot(conus)
nexttile
geoplot(conus)
Input Arguments
Projected coordinate reference system (CRS), specified as a projcrs object.
MapAxes objects use the projection method and projection parameters
stored in the projected CRS to transform geographic (latitude-longitude) coordinates to
projected (xy) coordinates.
By default, map axes objects use the World Geodetic System of 1984 (WGS 84) / Equal
Earth Greenwich projected CRS, which has the EPSG code 8857.
The projected CRS must have a forward and inverse projection implementation. Most projected CRSs have a forward and inverse projection implementation.
Since R2026b
Placename, specified as a string scalar or character vector. You can specify the names of world regions, states and provinces, counties, cities, street addresses and postal codes, and physical features.
The function searches an online provider and an installed list for the placename, then selects a projected CRS and creates a map for the matched region. The function can return different results in online and offline environments.
For more information about how the function selects a projection method, see Projection Method Selection. The function sets the area of use for the projected CRS using the bounds of the matched place.
If you specify a placename and the map covers a different area than you expect, then
specify a different placename or use the aoi input instead.
Data Types: char | string
Since R2026b
Area of interest (AOI), specified as one of these options:
A scalar
geopolyshapeobject. The function creates a projected CRS for the map using the bounds and geographic CRS of the object. If the object does not report a geographic CRS, then the projected CRS uses WGS 84. For more information about how the function selects a projection method, see Projection Method Selection.A scalar
mappolyshapeobject. The function creates the map using theprojcrsobject that is stored in theProjectedCRSproperty. TheProjectedCRSproperty must not be empty.
The function sets the area of use for the projected CRS using the bounds of the AOI.
For information about how to create areas of interest, see Define Areas of Interest.
Target to change or replace, specified as one of these options:
An axes object — An
Axes,PolarAxes,GeographicAxes, orMapAxesobject.A parent container — A
Figure,Panel,Tab,TiledChartLayout, orGridLayoutobject.
If you do not specify this argument, then the newmap function
uses the current axes.
Tips
If you want advanced control of the map axes, or you want to include the map axes in an
app, use the mapaxes
function.
Algorithms
When you specify the placename argument or specify the
aoi argument as a geopolyshape object, the
newmap function selects a projection method based on the size and
location of the region. The function selects the first match from this table.
| Region | Projection Method |
|---|---|
| Encompasses the entire world | Equal Earth |
| Is near the Equator with a narrow longitude span | Transverse Mercator |
| Is near the Equator | Mercator |
| Is less than a hemisphere tall, does not include a pole, and does not cross the Equator | Equidistant Conic |
| Is less than a hemisphere tall, does not include a pole, and can cross the Equator | Sinusoidal |
| Is a polar region | Polar Stereographic |
| Is less than a hemisphere wide and includes a pole | Polyconic |
| Is less than a hemisphere tall and includes a pole | Azimuthal Equidistant |
| All other regions | Miller Cylindrical |
The newmap function reuses or replaces existing figures and axes
depending on the NextPlot properties of the figure and axes.
First, the newmap function queries the NextPlot property of the figure.
If you specify the
targetinput argument, then the function uses the figure associated withtarget.If you do not specify the
targetinput argument, then the function uses the current figure. If there is no current figure, then the function creates a new figure.
This table shows how the newmap function changes the
figure based on the value of NextPlot.
Value of | Behavior of |
|---|---|
| The
|
| If you do not specify If you specify |
| The
This behavior is similar to using the |
| The
This behavior is similar to using the |
Then, the newmap function queries the NextPlot
property of the axes in the figure.
If you specify the
targetinput argument as an axes, then the function usestarget.If you do not specify the
targetinput argument, then the function uses the current axes. If there is no current axes, then the function creates a newMapAxesobject.
This table shows how the newmap function changes the axes based on
the value of NextPlot.
Value of | Behavior of |
|---|---|
| When the axes is a
When the axes is not a This behavior is similar to using
the |
| When the axes is a
When the axes is not a |
| When the axes is a
When the axes is not a This behavior is similar to using
the |
| When the axes is a
When the axes is not a This behavior is similar to using
the |
Version History
Introduced in R2023aCreate map axes from a placename or AOI by using the placename or
aoi input argument.
See Also
Functions
Properties
MATLAB Command
You clicked a link that corresponds to this MATLAB command:
Run the command by entering it in the MATLAB Command Window. Web browsers do not support MATLAB commands.
Select a Web Site
Choose a web site to get translated content where available and see local events and offers. Based on your location, we recommend that you select: .
You can also select a web site from the following list
How to Get Best Site Performance
Select the China site (in Chinese or English) for best site performance. Other MathWorks country sites are not optimized for visits from your location.
Americas
- América Latina (Español)
- Canada (English)
- United States (English)
Europe
- Belgium (English)
- Denmark (English)
- Deutschland (Deutsch)
- España (Español)
- Finland (English)
- France (Français)
- Ireland (English)
- Italia (Italiano)
- Luxembourg (English)
- Netherlands (English)
- Norway (English)
- Österreich (Deutsch)
- Portugal (English)
- Sweden (English)
- Switzerland
- United Kingdom (English)