geoglobe
Create geographic globe
Description
geoglobe( creates a geographic globe in
the specified figure, panel, or tab group. The figure must be created using the parent)uifigure function. For information about navigating the globe, see Geographic Globe Navigation.
The geographic globe requires hardware graphics support for WebGL™.
geoglobe(
specifies additional options for the globe using one or more name-value arguments. Specify
the options after all other input arguments. For a list of options, see parent,Name=Value)GeographicGlobe.
g = geoglobe(___) returns a
GeographicGlobe object. This syntax is useful for controlling the
properties of the geographic globe.
Examples
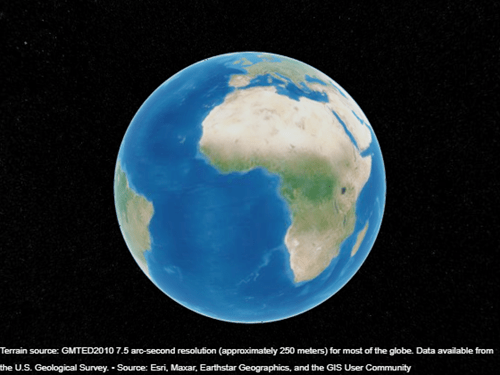
Display a geographic globe in a figure created using the uifigure function.
uif = uifigure;
g = geoglobe(uif);
Create a geographic globe. Specify the basemap using name-value arguments.
uif = uifigure;
g = geoglobe(uif,Basemap="landcover");
Change the basemap of an existing geographic globe by using the geobasemap function.
geobasemap(g,"streets-dark")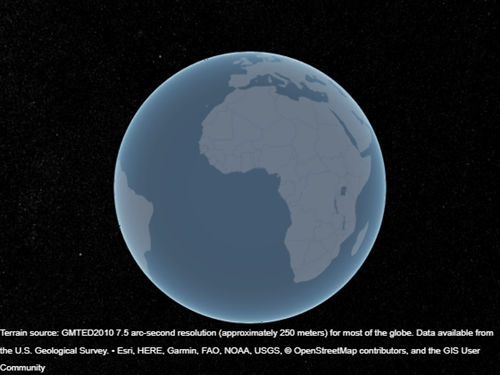
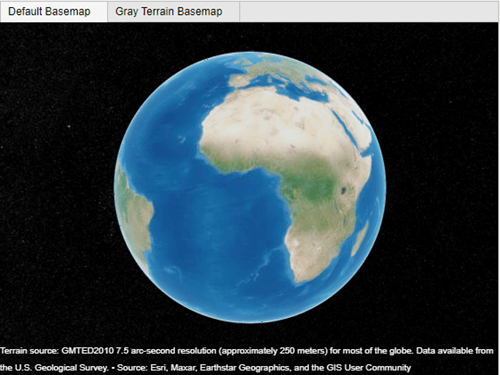
Create a tab group that fills an entire figure. To make the group fill the figure, specify the width and height of the group as the width and height of the figure. Then, display a geographic globe in each tab.
uif = uifigure;
pos = [0 0 uif.Position(3) uif.Position(4)];
tgroup = uitabgroup(uif,Position=pos);

tab1 = uitab(tgroup,Title="Default Basemap");
g1 = geoglobe(tab1);

tab2 = uitab(tgroup,Title="Gray Terrain Basemap");
g2 = geoglobe(tab2,Basemap="grayterrain");
Capture an image of a geographic globe by using the getframe function. Then, write the captured image to a file by using the imwrite function.
Create a geographic globe.
uif = uifigure;
g = geoglobe(uif);
Read the path of a UAV into the workspace as a geospatial table. Extract the latitude, longitude, and geoid height values from the table. Then, display the path on the geographic globe.
T = readgeotable("sample_uavtrack.gpx",Layer="track_points");

lat = T.Shape.Latitude;
lon = T.Shape.Longitude;
h = T.Elevation;

geoplot3(g,lat,lon,h,"c",LineWidth=2,HeightReference="geoid")
Change the view by setting the camera position, pitch angle, and heading angle.
campos(g,19.25,-155.45,2e4)
campitch(g,-25)
camheading(g,-15)
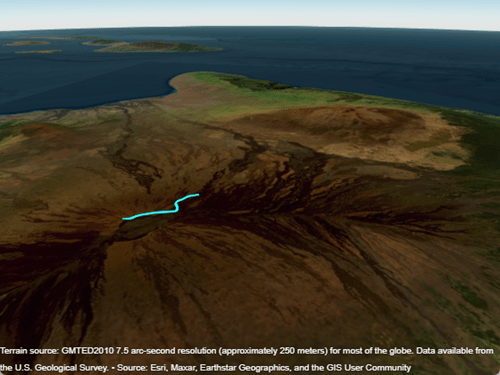
Apply pending updates to the globe by using the drawnow function. Then, capture an image of the geographic globe. Specify the figure that stores the globe as input to the getframe function.
drawnow
F = getframe(uif);
The output F is a structure with a cdata field that stores the captured image data. Display the image in a new figure.
figure
imshow(F.cdata)
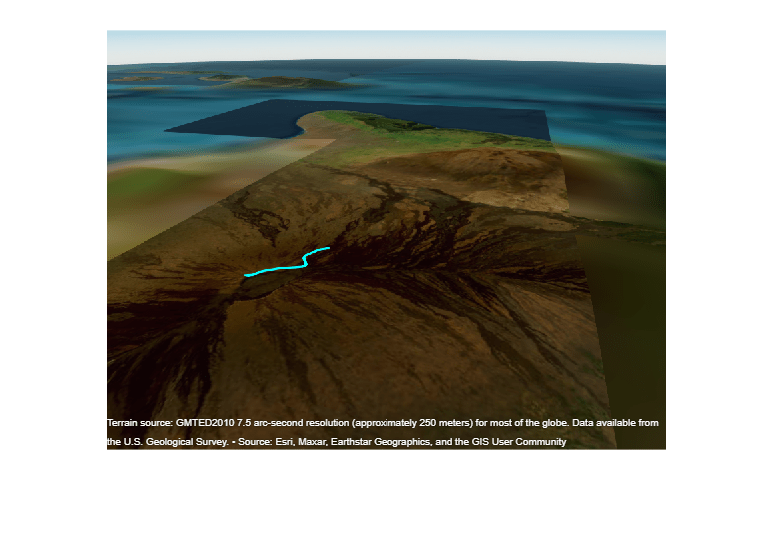
Write the captured image to a file.
imwrite(F.cdata,"globeImage.png")Input Arguments
Name-Value Arguments
Specify optional pairs of arguments as
Name1=Value1,...,NameN=ValueN, where Name is
the argument name and Value is the corresponding value.
Name-value arguments must appear after other arguments, but the order of the
pairs does not matter.
Example: geoglobe(uif,Basemap="streets") sets the basemap of the
geographic globe.
Before R2021a, use commas to separate each name and value, and enclose
Name in quotes.
Example: geoglobe(uif,"Basemap","streets") sets the basemap of the
geographic globe.
Note
Use name-value arguments to specify values for the properties of the
GeographicGlobe objects created by this function. The properties listed
here are only a subset. For a full list, see GeographicGlobe.
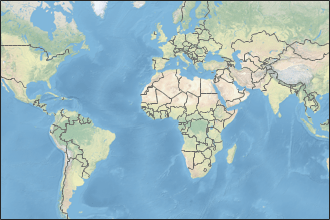
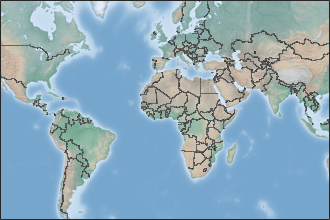
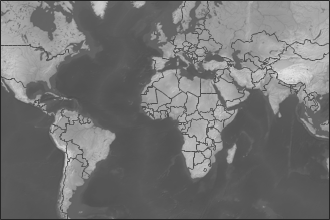
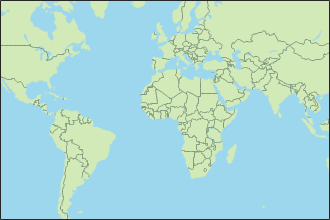
Map on which to plot data, specified as one of the values listed in the table. Six of the basemaps in the table are tiled data sets created using Natural Earth. Five of the basemaps are high-zoom-level maps hosted by Esri®.
|
|
Full global basemap composed of high-resolution satellite imagery. Hosted by Esri. |
|
General-purpose road map that emphasizes accurate, legible styling of roads and transit networks. Hosted by Esri. |
|
|
Map designed to provide geographic context while highlighting user data on a light background. Hosted by Esri. |
|
Map designed to provide geographic context while highlighting user data on a dark background. Hosted by Esri. |
|
|
General-purpose map with styling to depict topographic features. Hosted by Esri. |
|
Map that combines satellite-derived land cover data, shaded relief, and ocean-bottom relief. The light, natural palette is suitable for thematic and reference maps. Created using Natural Earth. |
|
|
Shaded relief map blended with a land cover palette. Humid lowlands are green and arid lowlands are brown. Created using Natural Earth. |
|
Terrain map in shades of gray. Shaded relief emphasizes both high mountains and micro-terrain found in lowlands. Created using Natural Earth. |
|
|
Two-tone, land-ocean map with light green land areas and light blue water areas. Created using Natural Earth. |
|
Two-tone, land-ocean map with gray land areas and white water areas. Created using Natural Earth. |
|
|
Two-tone, land-ocean map with light gray land areas and dark gray water areas. This basemap is installed with MATLAB®. Created using Natural Earth. | Not applicable. | Custom basemap added using the |


All basemaps except 'darkwater' require Internet access. The
'darkwater' basemap is included with MATLAB and Mapping Toolbox™.
If you do not have consistent access to the Internet, you can download the basemaps created using Natural Earth onto your local system by using the Add-On Explorer. The basemaps hosted by Esri are not available for download. For more about downloading basemaps and changing the default basemap on your local system, see Access Basemaps and Terrain for Geographic Globe.
The basemaps hosted by Esri update periodically. As a result, you might see differences in your visualizations over time.
Alignment of boundaries and region labels are a presentation of the feature provided by the data vendors and do not imply endorsement by MathWorks®.
Example: g = geoglobe(uifigure,'Basemap','bluegreen')
Example: g.Basemap = 'bluegreen'
Data Types: char | string
Terrain data, specified as one of these values:
'gmted2010'— Tiled global terrain derived from the GMTED2010 model by the U.S. Geological Survey (USGS) and National Geospatial-Intelligence Agency (NGA) and hosted by MathWorks. Internet access is required to use'gmted2010'.'none'— No terrain.String scalar or character vector — Name of custom terrain added using the
addCustomTerrainfunction.
Data Types: char | string
Since R2026a
Buildings data, specified as one of these values:
'none'— No buildings.String scalar or character vector — Name of custom buildings added using the
addCustomBuildingsfunction. The buildings must be within the extent of the terrain specified by theTerrainproperty.
Data Types: char | string
Size and location, specified as a four-element vector of the form [left bottom width height]. By default, MATLAB measures the values in units normalized to the container. To change the units, set the Units property.
The
leftandbottomelements define the distance from the lower-left corner of the container figure, panel, or tab to the lower-left corner of the position boundary.The
widthandheightelements are the position boundary dimensions.
This red line in this figure shows the position boundary of the geographic globe.

Position units, specified as one of these values.
Units | Description |
|---|---|
'normalized' (default) | Units normalized with respect to the container, which is typically the figure or a panel. The
lower left corner of the container is (0,0) and
the upper right corner is (1,1). |
'inches' | Inches. |
'centimeters' | Centimeters. |
'characters' | Units based on the default
|
'points' | Typography points. One point equals 1/72 inch. |
'pixels' | Pixels. On Windows® and Macintosh systems, the size of a pixel is 1/96th of an inch. This size is independent of your system resolution. On Linux® systems, the size of a pixel is determined by your system resolution. |
When specifying the units as a name-value pair during object creation, specify the
Units name-value pair before specifying name-value pairs that
use those units, for example Position.
Limitations
In the Live Editor, geographic globes appear in a separate window instead of within the live script.
Deploying geographic globes using MATLAB Compiler™ is not supported on Linux.
If multiple windows requiring WebGL are open at once, then the geographic globe might display this error:
Globe Viewer needs to close because the WebGL context has been lost.
More About
Tips
If you create a geographic globe with no output argument, then you can assign the globe to a variable later by using the
findallfunction.uif = uifigure; geoglobe(uif) g = findall(groot,Type="globe");If there is more than one geographic globe, then
findallreturns a vector of globe objects.uif = uifigure; geoglobe(uif) uif2 = uifigure; geoglobe(uif2) g = findall(groot,Type="globe")g = 2×1 GeographicGlobe array: GeographicGlobe GeographicGlobe