Add Legend to WMS Map
WMS servers render layers as images. About 45% of WMS servers in the WMS Database provide legends to help you interpret the pixel colors of the images. You can download the legend image for a layer by accessing the Details.Style.LegendURL field of the WMSLayer object.
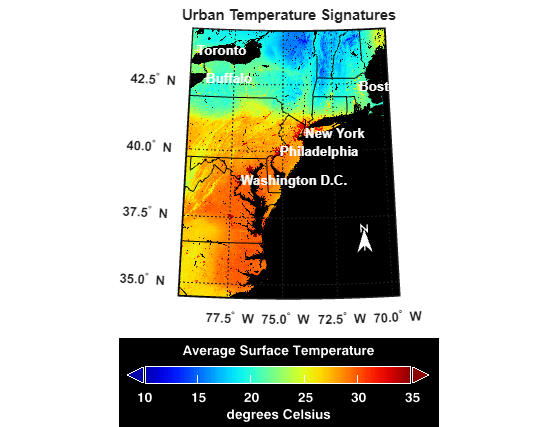
This example shows how to read and display a WMS map of surface temperatures, download the associated legend image, and combine the WMS map and legend into a single image.
Read and Display Map
Search the WMS Database for layers from the NASA Goddard Space Flight SVS Image Server, then find the layer that contains urban temperature signatures. Synchronize the layer with the server by using the wmsupdate function. To access the legend image, you must synchronize the layer with the server.
layers = wmsfind("svs.gsfc.nasa.gov",SearchField="serverurl");
urban_temperature = refine(layers,"urban*temperature");
urban_temperature = wmsupdate(urban_temperature);
Read and display the layer on a map.
[A,R] = wmsread(urban_temperature);
mapFigure = figure;
usamap(A,R)
geoshow(A,R)
Customize the map by adding city markers, state boundaries, meridian and parallel labels, a north arrow, and a title.
latlim = R.LatitudeLimits;
lonlim = R.LongitudeLimits;

GT = readgeotable("worldcities.shp");
cities = geoclip(GT.Shape,latlim,lonlim);
GT = GT(cities.NumPoints ~= 0,:);

geoshow(GT,MarkerEdgeColor='w',Color="w")
for k=1:height(GT)
    lat = GT(k,:).Shape.Latitude;
    lon = GT(k,:).Shape.Longitude;
    n = GT(k,:).Name;
    textm(lat,lon,n,Color="w",FontWeight="bold")
end

geoshow("usastatehi.shp",FaceColor="none",EdgeColor="black")

mlabel(FontWeight="bold")
plabel(FontWeight="bold")

northarrow(Facecolor="w",EdgeColor="w",Latitude=36.249,Longitude=-71.173)

title("Urban Temperature Signatures")

Search for Legend
Determine if a legend image is available by accessing the Details.Style.LegendURL field of the layer.
urban_temperature.Details.Style.LegendURL
ans = struct with fields:
    OnlineResource: 'http://svs.gsfc.nasa.gov/vis/a000000/a003100/a003152/temp_bar.png'
            Format: 'image/png'
            Height: 90
             Width: 320
The fields are not empty, so a legend is available. Download the legend image.
url = urban_temperature.Details.Style.LegendURL.OnlineResource;
legendImage = webread(url);
Create a figure and axes that are the same size as the image. Then, display the image. Note that the legend is an image of a colorbar, not a Legend object.
sz = size(legendImage);

legendFigure = figure;
pos = legendFigure.Position;
legendFigure.Position = [pos(1) pos(2) sz(2) sz(1)];

ax = gca;
ax.Units = "pixels";
ax.Position = [0 0 sz(2) sz(1)];

imshow(legendImage)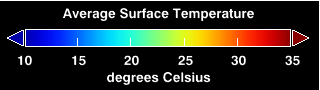
Combine Map and Legend
When you display images using the geoshow function, the map projection might cause text to appear warped. Instead, convert the map into an image and combine the map image with the legend image.
Convert the map into an image by using the getframe and frame2im functions.
mapImage = getframe(mapFigure);
mapImage = frame2im(mapImage);
To combine the images, the width of the images must be equal. In this example, the width of the legend image is smaller than the width of the map image. Make the widths the same by padding the legend image.
mapWidth = size(mapImage,2);
legendImage = paddata(legendImage,mapWidth,Dimension=2,Side="both",FillValue=255);
Combine the images.
combinedImage = [mapImage; legendImage];
Create a figure and axes that are the same size as the combined image. Display the combined image in the figure.
combinedsz = size(combinedImage);

combinedFigure = figure;
pos = combinedFigure.Position;
combinedFigure.Position = ...
    [pos(1) pos(2) combinedsz(2) combinedsz(1)];

ax = gca;
ax.Units = "pixels";
ax.Position = [0 0 combinedsz(2) combinedsz(1)];

imshow(combinedImage)