Main Content

houghpeaks

Identify peaks in Hough transform

Description

peaks = houghpeaks(H,numpeaks) locates peaks in the Hough transform matrix, H, and returns the (row, column) coordinates of the peaks. The function returns at most numpeaks peaks.

example

peaks = houghpeaks(H,numpeaks,Name=Value) controls aspects of the operation using name-value arguments. For example, specify Threshold=15 to consider only peaks that have a value of 15 or larger.

Examples

collapse all

Read an image into workspace, then display the image.

I  = imread("circuit.tif");
imageshow(I)

Rotate the image 50 degrees counterclockwise about the center of the image. Then, find the edges in the image.

Irot = imrotate(I,50,"crop");
BW = edge(Irot,"canny");
imageshow(BW)

Calculate the Hough transform of the rotated image.

[H,T,R] = hough(BW);

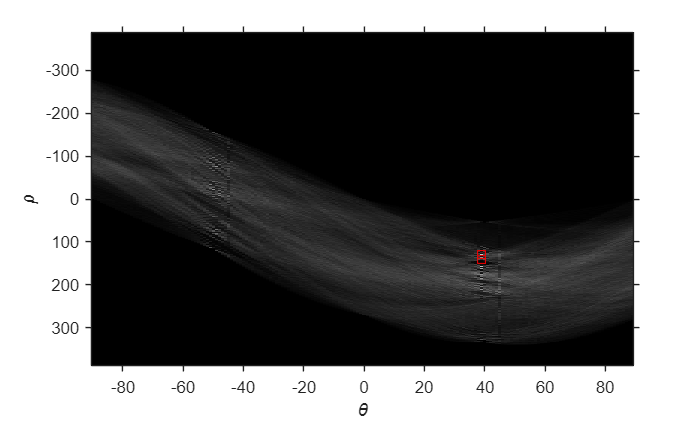
Find and plot the two strongest peaks in the Hough transform of the image.

P  = houghpeaks(H,2);
imshow(H,[],XData=T,YData=R);
xlabel("\theta")
ylabel("\rho")
axis on
axis normal
hold on
plot(T(P(:,2)),R(P(:,1)),"s",Color="red")

Figure contains an axes object. The axes object with xlabel theta, ylabel rho contains 2 objects of type image, line. One or more of the lines displays its values using only markers

Input Arguments

collapse all

Hough transform matrix, specified as a numeric matrix. The rows and columns correspond to rho and theta values. Create a Hough transform matrix by using the hough function.

Data Types: double

Maximum number of peaks to identify, specified as a positive integer.

Data Types: double

Name-Value Arguments

collapse all

Specify optional pairs of arguments as Name1=Value1,...,NameN=ValueN, where Name is the argument name and Value is the corresponding value. Name-value arguments must appear after other arguments, but the order of the pairs does not matter.

Example: P = houghpeaks(H,2,Threshold=15) specifies that the minimum value to be considered a peak is 15.

Before R2021a, use commas to separate each name and value, and enclose Name in quotes.

Example: P = houghpeaks(H,2,"Threshold",15);

Minimum value to be considered a peak, specified as a nonnegative number.

Data Types: double

Size of the suppression neighborhood, specified as a 2-element vector of positive odd integers. The suppression neighborhood is the neighborhood around each peak that is set to zero after the peak is identified. The default value of NHoodSize is the smallest odd values greater than or equal to size(H)/50. The dimensions of NHoodSize must be smaller than the size of the Hough transform matrix, H.

Data Types: double

Angles of the perpendicular projections to the lines, in degrees, specified as a numeric vector with elements in the range [-90, 90). The angles are measured in the clockwise direction from the x-axis. Each element of the vector specifies the theta value for the corresponding column of the Hough transform matrix H. The houghpeaks function uses the Theta values for peak suppression.

Note

If you called the hough function and specified the Theta name-value argument, then set this value as the theta output argument returned by the hough function. Otherwise, the houghpeaks function can return unexpected results for peak suppression.

Data Types: double

Output Arguments

collapse all

Row and column coordinates of located peaks, returned as a q-by-2 matrix where q is the number of detected peaks. The value q can range from 0 to numpeaks.

Extended Capabilities

expand all

Version History

Introduced before R2006a