Conduct Fault Sensitivity Study on Warehouse Robot
This example shows how to test an emergency brake system in a warehouse robot that activates after the robot detects a fault. This example uses a modified version of the model in Execute Tasks for a Warehouse Robot (Robotics System Toolbox) that includes a wheel braking mechanism. In this example, you inject faults into the control system to determine the conditions that affect when the robot detects the fault and stops the robot wheels from turning. To determine the fault properties that engage the fault detection logic, you run a fault sensitivity study. After finding the fault properties, you verify the results in a Failure Mode and Effects Analysis (FMEA) spreadsheet.
Inspect the Braking Mechanism
Open the model, warehouseTasksRobotSimulationModelFaulted.
mdlName = "warehouseTasksRobotSimulationModelFaulted";
open_system(mdlName)
Open the Emergency Brake subsystem to view the wheel braking model. The mechanism detects faults and prevents the robot from spinning uncontrollably. A MATLAB Function block calculates when the brake engages based on the angular momentum of the robot. If the model logic detects a fault, the model sends a signal to an Assertion block that stops the robot and the simulation.

Inspect the Faults
The model contains two faults that affect the angular velocity output of the controller. Open the Fault Table pane to view and select the faults. In the Apps tab, click Fault Analyzer. Then, in the Fault Analyzer tab, in the View section, click Fault Table. The angularVelocity_TimedSpin fault uses a timed trigger, and the angularVelocity_MaxPose uses a conditional trigger. angularVelocity_TimedSpin is injected when the simulation time is 50. angularVelocity_MaxPose is injected when the X position from the state output port of the Differential Drive Kinematic Model block is greater than 57, and continues to inject after it is triggered.

As you develop your conditionals, you may find that you need to update expressions to better represent fault injection conditions. You can adjust the signal threshold by adjusting the condition expression. For more information, see Create and Manage Conditionals.
Simulate Model with One Fault Behavior
To test if the current faults engage the fault detection, simulate the model. In this example, simulate with angularVelocity_TimedSpin activated.
In the Fault Table pane, select the Enable check box for the
Zero-Velocity At Goal/Unit Delay1/Outport/1model element. Then select the Active Fault check box for theangularVelocity_TimedSpinfault.Turn on fault simulation. In the Fault Analyzer tab, in the Status section, ensure the Fault Simulation button is enabled
Simulate the model.
You can view the simulation results in the Simulation Data Inspector. In the Fault Analyzer tab, in the Review Results section, click Data Inspector. In this example, the fault detection logic does not detect the fault, and does not engage the braking system. When the angularVelocity_TimedSpin is injected, the safetyLock signal remains at 0, and the assertion passes.

Enable the angularVelocity_MaxPos fault and simulate the model. This fault activates the detection logic, which deploys the wheel brake.
Perform Fault Sensitivity Study Using the Multiple Simulations Panel
The angularVelocity_TimedSpin fault uses the base workspace variable angularVelFaultGain to adjust the gain associated with the fault behavior. angularVelFaultGain is initially set to 2. Open the fault behavior for angularVelocity_TimedSpin.
fmdlName = "warehouseFaultedRobot_FaultModel";
open_system(fmdlName)
open_system(fmdlName + "/angularVelocity_TimedSpin")

In the fault behavior, the Gain parameter of the Gain block is set to angularVelFaultGain. Changing the value of this variable may engage the fault detection logic. To find this value, you can perform a fault sensitivity study by using the Multiple Simulations panel. In a fault sensitivity study, you select one or more faults for injection, and either vary the parameters assigned to the fault behaviors or trigger conditions to determine how sensitive the mitigation logic or safety mechanism is to the fault conditions. For more information on how to configure design studies in the Multiple Simulations panel, see Configure and Run Simulations with Multiple Simulations Panel and Simulate Models with Faults by Using the Multiple Simulations Panel.
In this example, run multiple simulations by sweeping through angularVelFaultGain and simulating at each value. This example includes a design study for this goal. To open the design study:
Open the Multiple Simulations panel. In the Fault Analyzer tab, in the Simulate section, click Multiple Simulations.
In the Multiple Simulations panel, load the design study. Click the Load file containing design studies button
 , and select the design study,
 faultDesignStudy.
The design study selects angularVelocity_TimedSpin as the active fault and creates a simulation for each value of angularVelFaultGain that starts at 2, increments by 0.2, and ends at 5. This design study runs 16 simulations.

Run the simulations. In the Simulink® Toolstrip, in the Fault Analyzer tab, in the Simulate section, click Run > Run All. If you have Parallel Computing Toolbox™, you can also enable parallel simulation of the design study to improve simulation speeds. In the Multiple Simulations panel, in the Run Options tab, click Use Parallel.
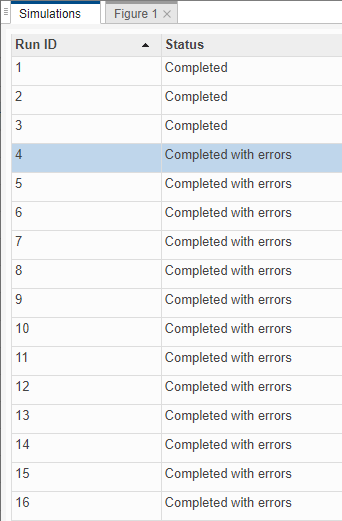
View the results in the Simulation Manager. At the bottom of the Simulink Editor, click Completed 16 simulations. Because the Assertion block stops the simulation when the detection mechanism detects a fault, you can see which angularVelFaultGain values engage the mechanism. The first simulation that engages the detection logic is the fourth simulation.
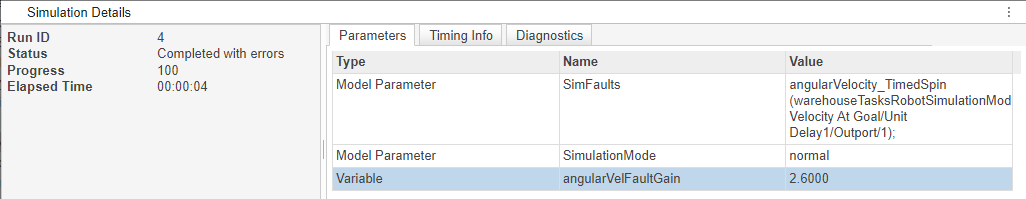
Click the Run ID column cell with the value 4 to view the value for the angularVelFaultGain variable for that simulation. The results indicate that the value is 2.6.
Verify Fault Detection Logic in an FMEA
After you configure the simulations that you want to run, you can link the faults to elements in the safety analysis spreadsheets that you create in the Safety Analysis Manager. In this example, the faults are linked to cell entries in an FMEA spreadsheet. An FMEA is a common safety analysis that analyzes unintended system or component behaviors, known as failure modes, with respect to their potential effects on the system. This analysis often includes how effective mitigation logic, such as safety mechanisms, are at detecting and preventing abnormal behavior.
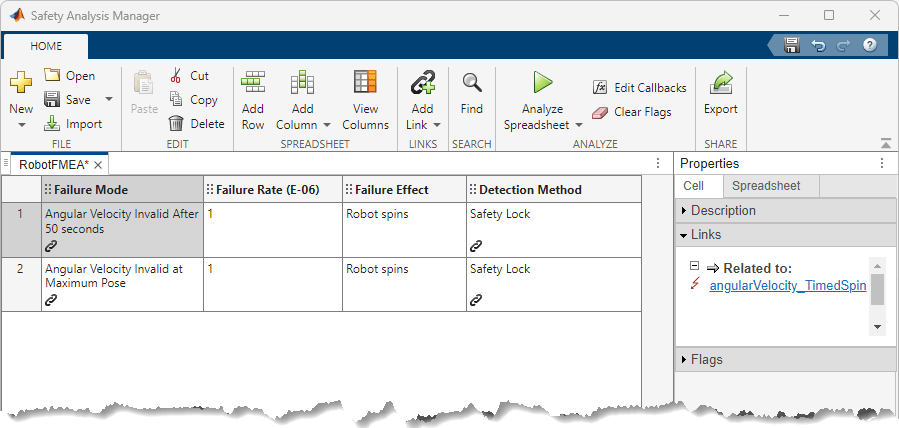
Open the FMEA spreadsheet, RobotFMEA.mldatx, in the Safety Analysis Manager.
robotFMEADoc = ...
    safetyAnalysisMgr.openDocument("RobotFMEA.mldatx");
safetyAnalysisMgr.openManager
The FMEA links each fault to a failure mode in the Failure Mode column, and the block that models the detection logic of the braking system in the Detection Method column. Point to the link icon ![]() to view the links. You can also view the links by selecting the cell. In the Properties pane, expand the Links section.
to view the links. You can also view the links by selecting the cell. In the Properties pane, expand the Links section.
Run Callback to Simulate and Evaluate FMEA
To analyze the spreadsheet, you create and execute a callback. See Write Callbacks to Analyze Safety Analysis Manager Spreadsheets. In this example, the spreadsheet executes a callback when you click Analyze Spreadsheet. The callback runs the code in the custom MATLAB® function, validateRobotFMEAUsingSimulation. For each row of the spreadsheet with at least one linked fault in the Failure Mode column, the function activates the faults and simulates. The function then checks if the safetyLock signal from the MATLAB Function block in the Emergency Brake subsystem is 1 at some point during simulation. If it is, the function adds a check flag to the cell to the adjacent cell in the Detection Method column. Otherwise, it adds an error flag.
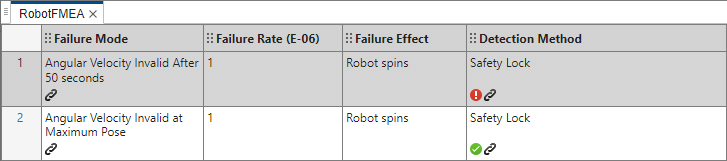
Click Analyze Spreadsheet. When you analyze the spreadsheet, the first failure mode does not execute the detection logic. This result is expected because angularVelFaultGain is 2.
runAnalysis(robotFMEADoc)
ans =
  DocumentFlag with properties:

             Type: 'error'
      Description: 'Failure mode not detected during simulation.'
              Tag: ''
    FlaggedObject: [1×1 safetyAnalysisMgr.SpreadsheetCell]
ans =
  DocumentFlag with properties:

             Type: 'check'
      Description: 'Failure mode detected during simulation.'
              Tag: ''
    FlaggedObject: [1×1 safetyAnalysisMgr.SpreadsheetCell]
To engage the fault detection logic for this failure mode, change angularVelFaultGain to 2.6 and run the callback again.
See Also
Topics
- Define and Model Faults
- Create Spreadsheets in the Safety Analysis Manager
- Fault Injection with Simulink Fault Analyzer
- Write Callbacks to Analyze Safety Analysis Manager Spreadsheets