Safety Analysis Manager
Description
The Safety Analysis Manager app lets you interact with the documents that you use for safety analyses. Using the Safety Analysis Manager, you can:
Create documents used for safety analyses, such as Failure Mode and Effects Analyses (FMEAs) and Functional Hazard Assessments (FHAs).
Link elements in documents to model artifacts such as requirements and faults.
Analyze your document but running MATLAB® callback code.

Open the Safety Analysis Manager App
MATLAB Toolstrip (since R2024b): On the Apps tab, in the Apps section, under Model Verification, Validation, and Test, click Safety Analysis Manager.
Simulink® Toolstrip: On the Apps tab, under Model Verification, Validation, and Test, click Safety Analysis Manager.
Fault Analyzer tab: In the Management section, click Safety Analysis Manager.
Examples
You can create a new spreadsheet by creating an empty spreadsheet or using a template that has specified columns and column types. To create a spreadsheet:
In the Safety Analysis Manager, in the File section, click New.
Create an empty spreadsheet by clicking Empty Spreadsheet. Alternatively, open a template in the From Template section. If you select From Template File, you must select a MLDATX template file.
To open a spreadsheet, in the File section, click Open. You can also press Ctrl+O if you are already in a spreadsheet. You must select a MLDATX spreadsheet file.
To create a spreadsheet using external files, such as an Excel® file, in the File section, click Import Spreadsheet. For more information on importing spreadsheets from Excel, see Import Excel Files into the Safety Analysis Manager.
To add a row to a spreadsheet, in the Spreadsheet section, click Add Row. To add a new column, in the Spreadsheet section, click Add Column. You can also add rows and columns with these modifications:
If you select a row and click Add Row, the spreadsheet adds the new row below the selected row.
If you select a row and click Add Column, the spreadsheet adds the new column to the right of the selected column.
If you select more than one row or column and click Add Row or Add Column, the spreadsheet adds an equal number of rows or columns to the spreadsheet. For example, if you select three rows and click Add Row, the spreadsheet adds three rows.
Rows automatically adjust to the height of the content in their cells. You can adjust the width of the columns manually.
To delete a row, click on the row index and, in the Edit section, click Delete.
To delete a column, click on the column label and, in the Edit section, click Delete.
Safety Analysis Manager spreadsheets must have at least one cell. Consequentially, you cannot delete the sole row or column in a spreadsheet.
Since R2024a
By default, columns are visible in Safety Analysis Manager spreadsheets. To hide columns:
Open an existing spreadsheet or create a new spreadsheet with at least two columns.
In the Spreadsheet section, click View Columns.
In the View Columns window, clear the columns that you want to hide and click OK.
Hidden columns retain their index, and you can still access their content by using
programmatic options. For more information on programmatic options, see Spreadsheet and Create and Configure Safety Analysis Manager Spreadsheets Programmatically.
Safety Analysis Manager spreadsheets must have at least one visible column.
If you create a template from a spreadsheet that has hidden columns, the template also hides the same columns (since R2026a).
By default, the Add Column button creates a text column. You can specify the type of column as you create it or after you add it.
To create a new check box column:
Open an existing spreadsheet or create a new spreadsheet.
In the Spreadsheet section, click Add Column > Checkbox.
You can also change the column type after you set it from the context menu. After creating the column, right-click the column label to access the context menu and click Column Type > Checkbox.
To create an enumeration column, define an enumeration class definition file on path. See Define Enumeration Classes. Then, specify an enumeration column and assign the enumeration class to the column. The entries in the column are limited to the entries in the class definition.
For example, to create an enumeration column that specifies a day out of the week:
In a new MATLAB file, define an enumeration class named
WeekDays.classdef WeekDays enumeration Sunday, % First day of the week Monday, % Second day of the week Tuesday, % Third day of the week Wednesday, % Fourth day of the week Thursday, % Fifth day of the week Friday, % Sixth day of the week Saturday % Seventh day of the week end end
Save the class definition on your file path with the name
WeekDays.m.In the Safety Analysis Manager, open an existing spreadsheet or create a new spreadsheet.
In the Spreadsheet section, click Add Column > Enumeration.
In the Enumeration Class window, enter the name of the class,
WeekDays, and click OK.
In the column, double-click a cell to expand the available values. If you point to the value, the list displays the comment that you include to the right of the value in the class definition file (since R2026a).
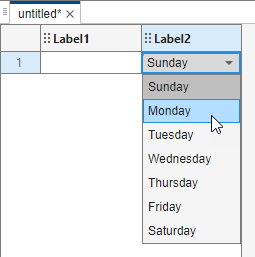
To set the cell value, click the value.
You can create derived columns that uses MATLAB code to retrieve information from the spreadsheet and adjust the column cell values. The information that you retrieve is read-only.
Suppose you have a spreadsheet with two text columns, Column1 and Column2, and you want to create a column that takes the strings in those columns and creates a new string. Create a derived column.
In the Spreadsheet section, click Add Column > Derived Value.
Right-click the column label and click Edit Formula.
In the Column Formula Editor window, retrieve the adjacent values of the column cells by using the
sfa_columnValueoperator, and assigning the new string to the cell by using thesfa_derivedCellkeyword:x = sfa_columnValue("Column1"); y = sfa_columnValue("Column2"); sfa_derivedValue = x + " " + y;
Close the Column Formula Editor window. The column now derives its cells from the adjacent cell values in Column1 and Column2.
To add a description to a spreadsheet:
Open or create a new Safety Analysis Manager spreadsheet.
In the Properties pane, in the Spreadsheet tab, add a description in the Description section.
To add a description to a row (since R2024b):
Click a row number in the spreadsheet.
In the Properties pane, in the Row tab, add a description in the Description section.
To add a description to a cell in a spreadsheet:
Click a cell in the spreadsheet.
In the Properties pane, in the Cell tab, add a description in the Description section.
This example shows how to create references in a derived column cell to cells in a different spreadsheet. For more information on creating references, see Create References in Derived Column Cells.
Open Spreadsheets
Open the Safety Analysis Manager and the qualityChecks and qualityRanks spreadsheets.
safetyAnalysisMgr.openManager
safetyAnalysisMgr.openDocument("qualityRanks.mldatx");
safetyAnalysisMgr.openDocument("qualityChecks.mldatx");
The qualityChecks spreadsheet has a derived column named Quality Evaluation.

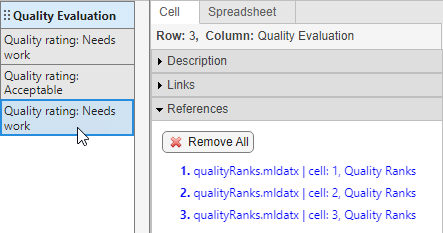
Click the cells in the derived column to view the references that each cell contains. In the Properties pane, in the Cell tab, expand the References section. The first two cells in the derived column reference the values in the qualityRanks spreadsheet, but the third cell does not. This image shows the references in the second cell.

Open the derived column formula to view the code. Right-click the column label and click Edit Formula. The formula retrieves the values from the Metric 1 and Metric 2 columns and uses these values to output the value of the referenced cell based on this logic:
If the derived column cell does not have references, the value of the derived column cell is
Add references to QualityRanks spreadsheet cells.If the derived column cell has references, but none of the values in the Metric 1 or Metric 2 columns are true, the derived column cell uses the first referenced cell value.
If the derived column cell has references, but only one of the values in the Metric 1 or Metric 2 columns is true, the derived column cell uses the second referenced cell value.
If the derived column cell has references, and both values in Metric 1 or Metric 2 columns is true, the derived column cell uses the third referenced cell value.
metric1 = sfa_columnValue("Metric 1");
metric2 = sfa_columnValue("Metric 2");

refValues = sfa_referencedValues;

if numel(refValues) == 0
    sfa_derivedValue = ...
        "Add references to QualityRanks spreadsheet cells";
elseif metric1 == true && metric2 == true
    sfa_derivedValue = ...
         "Quality rating: " + sfa_referencedValues{1};
elseif metric1 == true || metric2 == true
    sfa_derivedValue = ...
        "Quality rating: " + sfa_referencedValues{2};
else
    sfa_derivedValue = ...
        "Quality rating: " + sfa_referencedValues{3};
end
Create References
In this example, create references such that the third cell in Quality Evaluation column references the cells in the qualityRanks spreadsheet.
In the
qualityRanksspreadsheet, select the cells in the Quality Ranks column.In the Spreadsheet section, click Add Reference > Select for Referencing.
In the
qualityChecksspreadsheet, select the third cell in the derived column.in the Spreadsheet section, click Add Reference > Create Reference to Selection.
The qualityChecks spreadsheet now has references in the third derived column cell.
Click the check boxes in the Metric 1 and Metric 2 columns to update the output of the derived column cell. Similarly, if you adjust the values in the qualityRanks spreadsheet, the derived column also updates the cells that contain the references.
You can use callbacks to run MATLAB scripts when you do tasks like loading, analyzing, saving, or closing a document. To create a callback:
Open a document.
In the Analyze section, click Edit Callbacks. The Callbacks Editor window opens.
Enter your code in one or more of these callback types:
Callback Type When Callback Executes PreLoadFcn Before the spreadsheet loads PostLoadFcn After the spreadsheet loads AnalyzeFcn When you click Analyze Spreadsheet or press F5 PreSaveFcn Before the spreadsheet is saved PostSaveFcn After the spreadsheet is saved CloseFcn Before the spreadsheet is closed Exit the Callbacks Editor window to save the callbacks.
To modify the document by using the callback, retrieve the document object by using
the sfa_spreadsheet
keyword. For example, this code retrieves the Spreadsheet object and
stores it in the variable
x.
x = sfa_spreadsheet;
For more information, see Write Callbacks to Analyze Safety Analysis Manager Spreadsheets.
This example shows how to refresh derived cell values after you update an externally called MATLAB® function.
Inspect the Spreadsheet
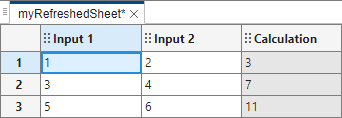
Open the Safety Analysis Manager and the spreadsheet, myRefreshedSheet.
safetyAnalysisManager
mySheet = safetyAnalysisMgr.openDocument("myRefreshedSheet.mldatx");
The Calculation column calls the external MATLAB function, myCalculationFunction, to multiply the values in the Input 1 and Input 2 columns, and outputs the result.

Open the myCalculatorFunction MATLAB file to view the code.
open("myCalculatorFunction")function output = myCalculatorFunction(x,y) output = str2double(x) * str2double(y); output = num2str(output); end
Update Calculations and Refresh Spreadsheet Cell Values
Change the myCalculationFunction function to add the two numbers.
function output = myCalculatorFunction(x,y)
    output = str2double(x) + str2double(y);
    output = num2str(output);
end
Save the function and return to the Safety Analysis Manager spreadsheet. The cell values are not updated. To call the updated function and recalculate the cell values, in the Spreadsheet section, click Refresh Values. The spreadsheet updates the calculated values in the Calculation column.
To programmatically refresh the cell values, use the refreshDerivedValues function.
The Diagnostics pane lists diagnostics from the scripts that you create in callbacks. The pane displays the same types of diagnostic messages that appear in the Diagnostic Viewer in Simulink models. See Diagnostic Viewer. You can use filters to display errors, warnings, or information.
At the bottom of the Safety Analysis Manager, expand the Diagnostics pane by clicking the Expand Bottom button
 .
. To display:
Information — Click the Show/Hide information button .
Warnings — Click the Show/Hide warnings button .
Errors — Click the Show/Hide errors button .
The pane displays the number of each kind of diagnostic message next to the corresponding button. Each message links to the document that contains the diagnostic.
To clear the diagnostics, click the Clear all diagnostics button .
After generating diagnostics, you can export them to a separate TXT file. To export diagnostics:
At the bottom of the Safety Analysis Manager, expand the Diagnostics pane by clicking the Expand Bottom button
. Click the Export diagnostics button .
Save the diagnostics as a TXT file.
To export a spreadsheet to Excel:
Open an existing spreadsheet.
In the Share section, click Export.
Save the file. When running Simulink in Windows®, you can save the file with the
.xls,.xlsb,.xlsm, or.xlsxextension. When running Simulink in macOS or Linux®, you can save the file with the.xls,.xlsm, or.xlsxextension.
To create document attributes:
Open an existing spreadsheet or create a new spreadsheet.
In the Properties pane, in the Spreadsheet tab, in the Document attributes section, click the Add new document attribute button .
To delete a document attribute, select the attribute and click the Delete document attribute button .
Related Examples
Parameters
Programmatic Use
Version History
Introduced in R2023bSee Also
Topics
- Create Spreadsheets in the Safety Analysis Manager
- Create and Register Templates in the Safety Analysis Manager
- Import Excel Files into the Safety Analysis Manager
- Write Callbacks to Analyze Safety Analysis Manager Spreadsheets
- Create and Select Custom Callbacks for Safety Analysis Manager Spreadsheets
- Create References in Derived Column Cells
- Link Safety Analysis Manager Spreadsheet Cells and Rows to Linkable Items
- Use Self-References in Derived Columns