filter
Filter disturbances through conditional variance model
Description
returns the table or timetable Tbl2 = filter(Mdl,Tbl1)Tbl2 containing the results
from filtering the paths of disturbances in the input table or timetable
Tbl1 through Mdl. The disturbance
variable in Tbl1 is associated with the model innovations
process through Mdl. (since R2023a)
filter selects the response variable named in
Mdl.SeriesName or the sole variable in
Tbl1. To select a different disturbance variable in
Tbl1 to filter through the model, use the
DisturbanceVariable name-value argument.
[___] = filter(___,
specifies options using one or more name-value arguments in
addition to any of the input argument combinations in previous syntaxes.
Name,Value)filter returns the output argument combination for the
corresponding input arguments. For example, filter(Mdl,Z,Z0=PS) filters the
numeric vector of disturbances Z through the conditional
variance model Mdl and specifies the numeric vector of
presample disturbance data PS to initialize the model.
Examples
Demonstrate that simulate and filter can return equal quantities. Supply data in a numeric vector.
Specify a GARCH(1,1) model with Gaussian innovations.
Mdl = garch(Constant=0.005,GARCH=0.8,ARCH=0.1);
Simulate the model using Monte Carlo simulation. Then, standardize the simulated innovations and filter them.
rng(1) % For reproducibility
[vs,es] = simulate(Mdl,100,E0=0,V0=0.05);
Z = es./sqrt(vs);
[vf,ef] = filter(Mdl,Z,Z0=0,V0=0.05);Confirm that the outputs of simulate and filter are identical.
norm(vs-vf)
ans = 0
A norm of 0 indicates that the two outputs are identical.
Since R2023a
Fit a GARCH(1,1) model to the average weekly closing NASDAQ returns, and then filter a randomly generated series of disturbances through the estimated model. Supply timetables of data throughout the process.
Load the U.S. equity indices data Data_EquityIdx.mat.
load Data_EquityIdxThe timetable DataTimeTable contains the daily NASDAQ closing prices, among other indices.
Compute the weekly average closing prices of all timetable variables.
DTTW = convert2weekly(DataTimeTable,Aggregation="mean");Compute the weekly returns.
DTTRet = price2ret(DTTW); DTTRet.Interval = []; T = height(DTTRet)
T = 626
Plot the weekly NASDAQ returns.
figure
plot(DTTRet.Time,DTTRet.NASDAQ)
title("NASDAQ Weekly Returns")
The returns exhibit volatility clustering.
When you plan to supply a timetable, you must ensure it has all the following characteristics:
The selected response variable is numeric and does not contain any missing values.
The timestamps in the
Timevariable are regular, and they are ascending or descending.
Remove all missing values from the timetable, relative to the NASDAQ returns series.
DTTRet = rmmissing(DTTRet,DataVariables="NASDAQ");
numobs = height(DTTRet)numobs = 626
Because all sample times have observed NASDAQ returns, rmmissing does not remove any observations.
Determine whether the sampling timestamps have a regular frequency and are sorted.
areTimestampsRegular = isregular(DTTRet,"weeks")areTimestampsRegular = logical
1
areTimestampsSorted = issorted(DTTRet.Time)
areTimestampsSorted = logical
1
areTimestampsRegular = 1 indicates that the timestamps of DTTRet represent a regular weekly sample. areTimestampsSorted = 1 indicates that the timestamps are sorted.
Specify a GARCH(1,1) model, and fit it to the series. Name the response series of the model NASDAQ by using dot notation.
Mdl = garch(1,1);
Mdl.SeriesName = "NASDAQ";
EstMdl = estimate(Mdl,DTTRet);
GARCH(1,1) Conditional Variance Model (Gaussian Distribution):
Value StandardError TStatistic PValue
__________ _____________ __________ __________
Constant 3.0642e-07 3.9847e-07 0.76899 0.4419
GARCH{1} 0.86476 0.01831 47.229 0
ARCH{1} 0.11873 0.019946 5.9527 2.6373e-09
estimate fits the model to the response data in the NASDAQ variable of DTTRet because the name matches the name of the response variable in Mdl.SeriesName. Alternatively, you can specify the response variable by using the ResponseVariable name-value argument.
Generate 2 random, independent series of length T from the standard Gaussian distribution. Store the matrix of series as one variable in DTTRet.
rng(1) % For reproducibility
DTTRet.Z = randn(T,2);DTTRet contains a new variable called Z containing a T-by-2 matrix of five disturbance paths.
Filter the paths of disturbances through the estimated GARCH model. Specify the table variable name containing the disturbance paths.
Tbl2 = filter(EstMdl,DTTRet,DisturbanceVariable="Z")Tbl2=626×5 timetable
Time NYSE NASDAQ Z NASDAQ_Variance NASDAQ_Response
___________ ___________ ___________ _____________________ ________________________ __________________________
12-Jan-1990 -0.0031597 -0.0026701 -0.64901 -0.50964 1.8243e-05 1.6784e-05 -0.0027721 -0.0020879
19-Jan-1990 -0.0038123 -0.0039103 1.1812 0.088893 1.6995e-05 1.5339e-05 0.0048693 0.00034814
26-Jan-1990 -0.0040706 -0.0039139 -0.75845 -0.019698 1.7818e-05 1.3585e-05 -0.0032015 -7.2603e-05
02-Feb-1990 -0.00099691 -0.0033847 -1.1096 -0.73807 1.6932e-05 1.2055e-05 -0.0045658 -0.0025626
09-Feb-1990 0.0022796 0.0031891 -0.84555 -1.1522 1.7423e-05 1.1511e-05 -0.0035295 -0.003909
16-Feb-1990 -0.00021948 0.00037747 -0.57266 -1.9476 1.6853e-05 1.2075e-05 -0.0023509 -0.0067676
23-Feb-1990 -0.0022725 -0.0018693 -0.55868 0.026296 1.5536e-05 1.6186e-05 -0.0022021 0.00010579
02-Mar-1990 0.0019481 0.0012208 0.17838 -0.82589 1.4317e-05 1.4305e-05 0.00067496 -0.0031237
09-Mar-1990 0.0022677 0.0026984 -0.19686 -0.71799 1.2741e-05 1.3835e-05 -0.0007027 -0.0026706
16-Mar-1990 0.00029781 0.0012667 0.58644 -1.941 1.1383e-05 1.3118e-05 0.0019786 -0.0070299
23-Mar-1990 0.00027271 0.00042646 -0.85189 0.98755 1.0615e-05 1.7518e-05 -0.0027755 0.0041333
30-Mar-1990 0.00022176 -0.00052576 0.80032 -1.6631 1.0401e-05 1.7483e-05 0.002581 -0.006954
06-Apr-1990 0.00016495 -0.0010113 -1.5094 2.0633 1.0091e-05 2.1167e-05 -0.0047949 0.0094929
13-Apr-1990 0.00050551 -0.00037366 0.87587 -2.082 1.1763e-05 2.9311e-05 0.003004 -0.011272
20-Apr-1990 -0.00072855 -0.00042758 -0.24279 0.27316 1.155e-05 4.0739e-05 -0.00082513 0.0017435
27-Apr-1990 -0.0039166 -0.0039974 0.16681 -2.3767 1.0375e-05 3.5897e-05 0.00053732 -0.01424
⋮
Tbl2 is a 626-by-5 timetable containing all variables in DTTRet, the two filtered conditional variance paths NASDAQ_Variance, and the two filtered response paths NASDAQ_Response.
Specify an EGARCH(1,1) model with Gaussian innovations.
Mdl = egarch(Constant=-0.1,GARCH=0.8,ARCH=0.3, ...
Leverage=-0.05);Simulate 25 series of standard Gaussian observations for 100 periods.
rng(1); % For reproducibility
Z = randn(100,25);Z represents 25 paths of synchronized disturbances for 100 periods.
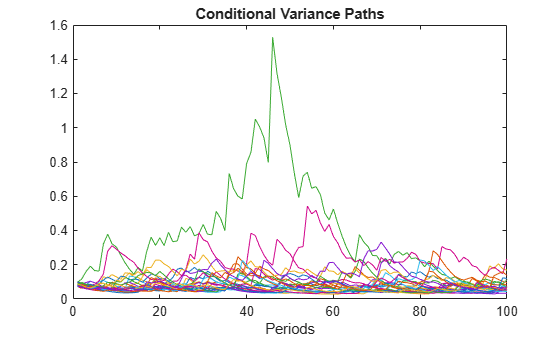
Obtain 25 paths of conditional variances by filtering the disturbance paths through the EGARCH(1,1) model.
V = filter(Mdl,Z);
Plot the paths of conditional variances.
figure; plot(V); title("Conditional Variance Paths"); xlabel("Periods");

Specify a GJR(1,2) model with Gaussian innovations.
Mdl = gjr(Constant=0.005,GARCH=0.8,ARCH={0.1 0.01}, ...
Leverage={0.05 0.01});Simulate 25 series of standard Gaussian observations for 102 periods.
rng(1); % For reproducibility
Z = randn(102,25);Z represents 25 paths of synchronized disturbances for 102 periods.
Obtain 25, 100 period paths of conditional variances by filtering the disturbance paths through the GJR(1,2) model. Specify the first two disturbances as presample observations.
V = filter(Mdl,Z(3:end,:),Z0=Z(1:2,:));
Plot the paths of conditional variances.
figure plot(V) title("Conditional Variance Paths"); xlabel("Periods");

Input Arguments
Disturbance paths zt used to
drive the output innovation process
εt, specified as a
numobs-by-1 numeric vector or
numobs-by-numpaths numeric matrix.
Given the variance process
σt2,
the innovation process is
As a column vector, Z represents a single path of the
underlying disturbance series.
As a matrix, the rows of Z correspond to periods. The
columns correspond to separate paths. The observations across any row occur
simultaneously.
The last element or row of Z contains the latest
observation.
Since R2023a
Time series data containing observed disturbance variable
zt, associated with the
model innovations process εt,
specified as a table or timetable with numvars variables
and numobs rows. You can optionally select a disturbance
variable by using the DisturbanceVariable name-value
argument.
Given the variance process σt2, the innovation process is
The selected variable is a single path (numobs-by-1
vector) or multiple paths
(numobs-by-numpaths matrix) of
numobs observations of disturbance data. Each row is
an observation, and measurements in each row occur simultaneously.
Each path (column) of the selected variable is independent of the other paths.
If Tbl1 is a timetable, it must represent a sample
with a regular datetime time step (see isregular), and the datetime
vector Tbl1.Time must be strictly ascending or
descending.
If Tbl1 is a table, the last row contains the latest
observation.
Name-Value Arguments
Specify optional pairs of arguments as
Name1=Value1,...,NameN=ValueN, where Name is
the argument name and Value is the corresponding value.
Name-value arguments must appear after other arguments, but the order of the
pairs does not matter.
Before R2021a, use commas to separate each name and value, and enclose
Name in quotes.
Example: filter(Mdl,Z,Z0=[1 1;0.5 0.5],V0=[1 0.5;1 0.5])
specifies two equivalent presample paths of disturbances and two different presample
paths of conditional variances.
Since R2023a
Variable to select from Tbl1 to treat as the
disturbance variable zt to
filter through Mdl, specified as one of the
following data types:
String scalar or character vector containing a variable name in
Tbl1.Properties.VariableNamesVariable index (positive integer) to select from
Tbl1.Properties.VariableNamesA logical vector, where
DisturbanceVariable(selects variablej) = truefromjTbl1.Properties.VariableNames
The selected variable must be a numeric vector and cannot contain
missing values (NaN).
If Tbl1 has one variable, the default specifies
that variable. Otherwise, the default matches the variable to names in
Mdl.SeriesName.
Example: DisturbanceVariable="StockRateDist"
Example: DisturbanceVariable=[false false true
false] or DisturbanceVariable=3 selects
the third table variable as the disturbance variable.
Data Types: double | logical | char | cell | string
Presample disturbance paths
zt, specified as a
numpreobs-by-1 numeric vector or
numpreobs-by-numprepaths
matrix. Z0 provides initial values for the input
disturbance paths Z. Use Z0 only
when you supply the numeric array of disturbances
Z.
numpreobs is the number of presample observations.
numprepaths is the number of presample response
paths.
Each row is a presample observation, and measurements in each row
occur simultaneously. The last row contains the latest presample
observation. numpreobs must be at least
Mdl.Q. If numpreobs >
Mdl.Q, filter uses the
latest required number of observations only.
If
Z0is a column vector, it represents a single path of the underlying disturbance series.filterapplies it to each output path.If
Z0is a matrix, each column represents a presample path of the underlying disturbance series.numprepathsmust be at leastnumpaths. Ifnumprepaths>numpaths,filteruses the firstsize(Z,2)columns only.
By default, filter sets any necessary
presample disturbances to an independent sequence of standardized
disturbances drawn from Mdl.Distribution.
Data Types: double
Positive presample conditional variance paths
σt2,
specified as a numpreobs-by-1 positive column vector
or numpreobs-by-numprepaths
positive matrix. V0 provides initial values for the
conditional variances in the model. Use V0 only when
you supply the numeric array of disturbances
Z.
To initialize the conditional variance model,
numpreobs must be at least max([Mdl.P
Mdl.Q]). If numpreobs >
max([Mdl.P Mdl.Q]),
filter uses the latest required number of
observations only. The last element or row contains the latest
observation.
If
V0is a column vector, it represents a single path of the conditional variance series.filterapplies it to each output path.If
V0is a matrix,numprepathsmust be at leastnumpaths. Ifnumprepaths>numpaths,filteruses the firstsize(Z,2)columns only.
By default, filter sets any necessary
presample conditional variances to the unconditional variance of the
process.
Data Types: double
Since R2023a
Presample data containing paths of innovation
εt or conditional
variance
σt2
series to initialize the model, specified as a table or timetable, the
same type as Tbl1, with
numprevars variables and
numpreobs rows. Use
Presample only when you supply a table or
timetable of data Tbl1.
Each selected variable is a single path
(numpreobs-by-1 vector) or multiple paths
(numpreobs-by-numprepaths
matrix) of numpreobs observations representing the
presample of the disturbance or conditional variance series for
DisturbanceVariable, the selected disturbance
variable in Tbl1.
Each row is a presample observation, and measurements in each row
occur simultaneously. numpreobs must be one of the
following values:
Mdl.QwhenPresampleprovides only presample disturbancesmax([Mdl.P Mdl.Q])whenPresampleprovides presample conditional variances
If you supply more rows than necessary,
filter uses the latest required number of
observations only.
If Presample is a timetable, all the following
conditions must be true:
Presamplemust represent a sample with a regular datetime time step (seeisregular).The inputs
Tbl1andPresamplemust be consistent in time such thatPresampleimmediately precedesTbl1with respect to the sampling frequency and order.The datetime vector of sample timestamps
Presample.Timemust be ascending or descending.
If Presample is a table, the last row contains
the latest presample observation.
By default, filter sets any necessary
presample disturbances to an independent sequence of standardized
disturbances drawn from Mdl.Distribution, and it
sets any necessary presample conditional variances to the unconditional
variance of the process characterized by
Mdl.
If you specify the Presample, you must specify
the presample disturbance or conditional variance names by using the
PresampleDisturbanceVariable or
PresampleVarianceVariable name-value
argument.
Since R2023a
Variable of Presample containing presample
disturbance paths zt,
specified as one of the following data types:
String scalar or character vector containing a variable name in
Presample.Properties.VariableNamesVariable index (positive integer) to select from
Presample.Properties.VariableNamesA logical vector, where
PresampleDisturbanceVariable(selects variablej) = truefromjPresample.Properties.VariableNames
The selected variable must be a numeric matrix and cannot contain
missing values (NaNs).
If you specify presample disturbance data by using the
Presample name-value argument, you must specify
PresampleDisturbanceVariable.
Example: PresampleDisturbanceVariable="StockRateDist0"
Example: PresampleDisturbanceVariable=[false false true
false] or
PresampleDisturbanceVariable=3 selects the third
table variable as the presample disturbance variable.
Data Types: double | logical | char | cell | string
Since R2023a
Variable of Presample containing data for the presample conditional
variances
σt2,
specified as one of the following data types:
String scalar or character vector containing a variable name in
Presample.Properties.VariableNamesVariable index (positive integer) to select from
Presample.Properties.VariableNamesA logical vector, where
PresampleVarianceVariable(selects variablej) = truefromjPresample.Properties.VariableNames
The selected variable must be a numeric vector and cannot contain missing values
(NaNs).
If you specify presample conditional variance data by using the Presample name-value argument, you must specify PresampleVarianceVariable.
Example: PresampleVarianceVariable="StockRateVar0"
Example: PresampleVarianceVariable=[false false true false] or PresampleVarianceVariable=3 selects the third table variable as the presample conditional variance variable.
Data Types: double | logical | char | cell | string
Note
NaNvalues inZ,Z0, andV0indicate missing values.filterremoves missing values from specified data by list-wise deletion.For the presample,
filterhorizontally concatenatesZ0andV0, and then it removes any row of the concatenated matrix containing at least oneNaN.For in-sample data
Z,filterremoves any row containing at least oneNaN.
This type of data reduction reduces the effective sample size and can create an irregular time series.
For numeric data inputs,
filterassumes that you synchronize the presample data such that the latest observations occur simultaneously.filterissues an error when any table or timetable input contains missing values.
Output Arguments
Filtered conditional variance paths
σt2,
returned as a numobs-by-1 numeric column vector or
numobs-by-numpaths numeric matrix.
V represents the conditional variances of the
mean-zero, heteroscedastic innovations associated with
Y. filter returns
V only when you supply the input
Z.
The dimensions of V and Z are
equivalent. If Z is a matrix, then the columns of
V are the conditional variance paths corresponding to
the columns of Z.
Rows of V are periods corresponding to the periodicity
of Z.
Filtered response paths yt,
returned as a numobs-by-1 numeric column vector or
numobs-by-numpaths.
Y usually represents a mean-zero, heteroscedastic
time series of innovations with conditional variances given in
V. filter returns
Y only when you supply the input
Z.
Y can also represent a time series of mean-zero,
heteroscedastic innovations plus an offset. If Mdl
includes an offset, then filter adds the offset to
the underlying mean-zero, heteroscedastic innovations. Therefore,
Y represents a time series of offset-adjusted
innovations.
If Z is a matrix, then the columns of
Y are the response paths corresponding to the columns
of Z.
Rows of Y are periods corresponding to the periodicity
of Z.
Since R2023a
Filtered conditional variance
σt2
and response yt paths, returned as
a table or timetable, the same data type as Tbl1.
filter returns Tbl2 only
when you supply the input Tbl1.
Tbl2 contains the following variables:
The filtered conditional variances paths, which are in a
numobs-by-numpathsnumeric matrix, with rows representing observations and columns representing independent paths, each corresponding to the input observations and paths of the disturbance variable inTbl1.filternames the filtered conditional variance variable inTbl2, whereresponseName_VarianceisresponseNameMdl.SeriesName. For example, ifMdl.SeriesNameisStockReturns,Tbl2contains a variable for the corresponding filtered response paths with the nameStockReturns_Variance.The filtered response paths, which are in a
numobs-by-numpathsnumeric matrix, with rows representing observations and columns representing independent paths, each corresponding to the input observations and paths of the disturbance variable inTbl1.filternames the filtered response variable inTbl2, whereresponseName_ResponseisresponseNameMdl.SeriesName. For example, ifMdl.SeriesNameisStockReturns,Tbl2contains a variable for the corresponding filtered conditional variance paths with the nameStockReturns_Response.All variables
Tbl1.
If Tbl1 is a timetable, row times of
Tbl1 and Tbl2 are
equal.
Alternatives
filter generalizes simulate. Both function filter a series of disturbances to produce
output responses and conditional variances. However, simulate
autogenerates a series of mean-zero, unit-variance, independent and identically
distributed (iid) disturbances according to the distribution in the conditional variance
model object, Mdl. In contrast, filter
lets you directly specify your own disturbances.
References
[1] Bollerslev, T. “Generalized Autoregressive Conditional Heteroskedasticity.” Journal of Econometrics. Vol. 31, 1986, pp. 307–327.
[2] Bollerslev, T. “A Conditionally Heteroskedastic Time Series Model for Speculative Prices and Rates of Return.” The Review of Economics and Statistics. Vol. 69, 1987, pp. 542–547.
[3] Box, G. E. P., G. M. Jenkins, and G. C. Reinsel. Time Series Analysis: Forecasting and Control. 3rd ed. Englewood Cliffs, NJ: Prentice Hall, 1994.
[4] Enders, W. Applied Econometric Time Series. Hoboken, NJ: John Wiley & Sons, 1995.
[5] Engle, R. F. “Autoregressive Conditional Heteroskedasticity with Estimates of the Variance of United Kingdom Inflation.” Econometrica. Vol. 50, 1982, pp. 987–1007.
[6] Hamilton, J. D. Time Series Analysis. Princeton, NJ: Princeton University Press, 1994.
Version History
Introduced in R2012aIn addition to accepting input data (in-sample and presample) in numeric arrays,
filter accepts input data in tables or regular
timetables. When you supply data in a table or timetable, the following conditions
apply:
filterchooses the default in-sample disturbance series on which to operate, but you can use the specified optional name-value argument to select a different series.If you specify optional presample disturbance or conditional variance data to initialize the model, you must also specify the presample disturbance or conditional variance series name.
filterreturns results in a table or timetable.
Name-value arguments to support tabular workflows include:
DisturbanceVariablespecifies the variable name of the disturbance paths in the input dataTbl1to filter through the model.Presamplespecifies the input table or timetable of presample disturbance and conditional variance data.PresampleDisturbanceVariablespecifies the variable name of the disturbance paths to select fromPresample.PresampleVarianceVariablespecifies the variable name of the conditional variance paths to select fromPresample.
MATLAB Command
You clicked a link that corresponds to this MATLAB command:
Run the command by entering it in the MATLAB Command Window. Web browsers do not support MATLAB commands.
Select a Web Site
Choose a web site to get translated content where available and see local events and offers. Based on your location, we recommend that you select: .
You can also select a web site from the following list
How to Get Best Site Performance
Select the China site (in Chinese or English) for best site performance. Other MathWorks country sites are not optimized for visits from your location.
Americas
- América Latina (Español)
- Canada (English)
- United States (English)
Europe
- Belgium (English)
- Denmark (English)
- Deutschland (Deutsch)
- España (Español)
- Finland (English)
- France (Français)
- Ireland (English)
- Italia (Italiano)
- Luxembourg (English)
- Netherlands (English)
- Norway (English)
- Österreich (Deutsch)
- Portugal (English)
- Sweden (English)
- Switzerland
- United Kingdom (English)