Getting Started with Hardware Profiling
This example demonstrates how to perform real-time execution profiling of algorithms using the Embedded Coder® Support Package for STMicroelectronics® STM32 Processors. It covers two primary profiling methods:
GPIO Based Profiling (General Purpose Input/Output)
This example enables you to profile function-call subsystems on target hardware efficiently, leveraging both GPIO and Timer-based approaches. Additionally, it includes techniques for Profiling Motor Control Algorithms using either GPIO or Timer-based methods.
Required Hardware
This example is preconfigured to run on the STM32G474RE Nucleo board. However the steps to perform profiling on any STM32 hardware with the required configurations is explained in the example.
GPIO Based Profiling
Available Models
You can use the stm32_gpio_based_profiling.slx model for code generation. You can also use open_system command to open the Simulink® models. For example, use this command for a STM32 Processor based Boards:
open_system('GettingStartedProfilingSTM32/stm32_gpio_based_profiling.slx');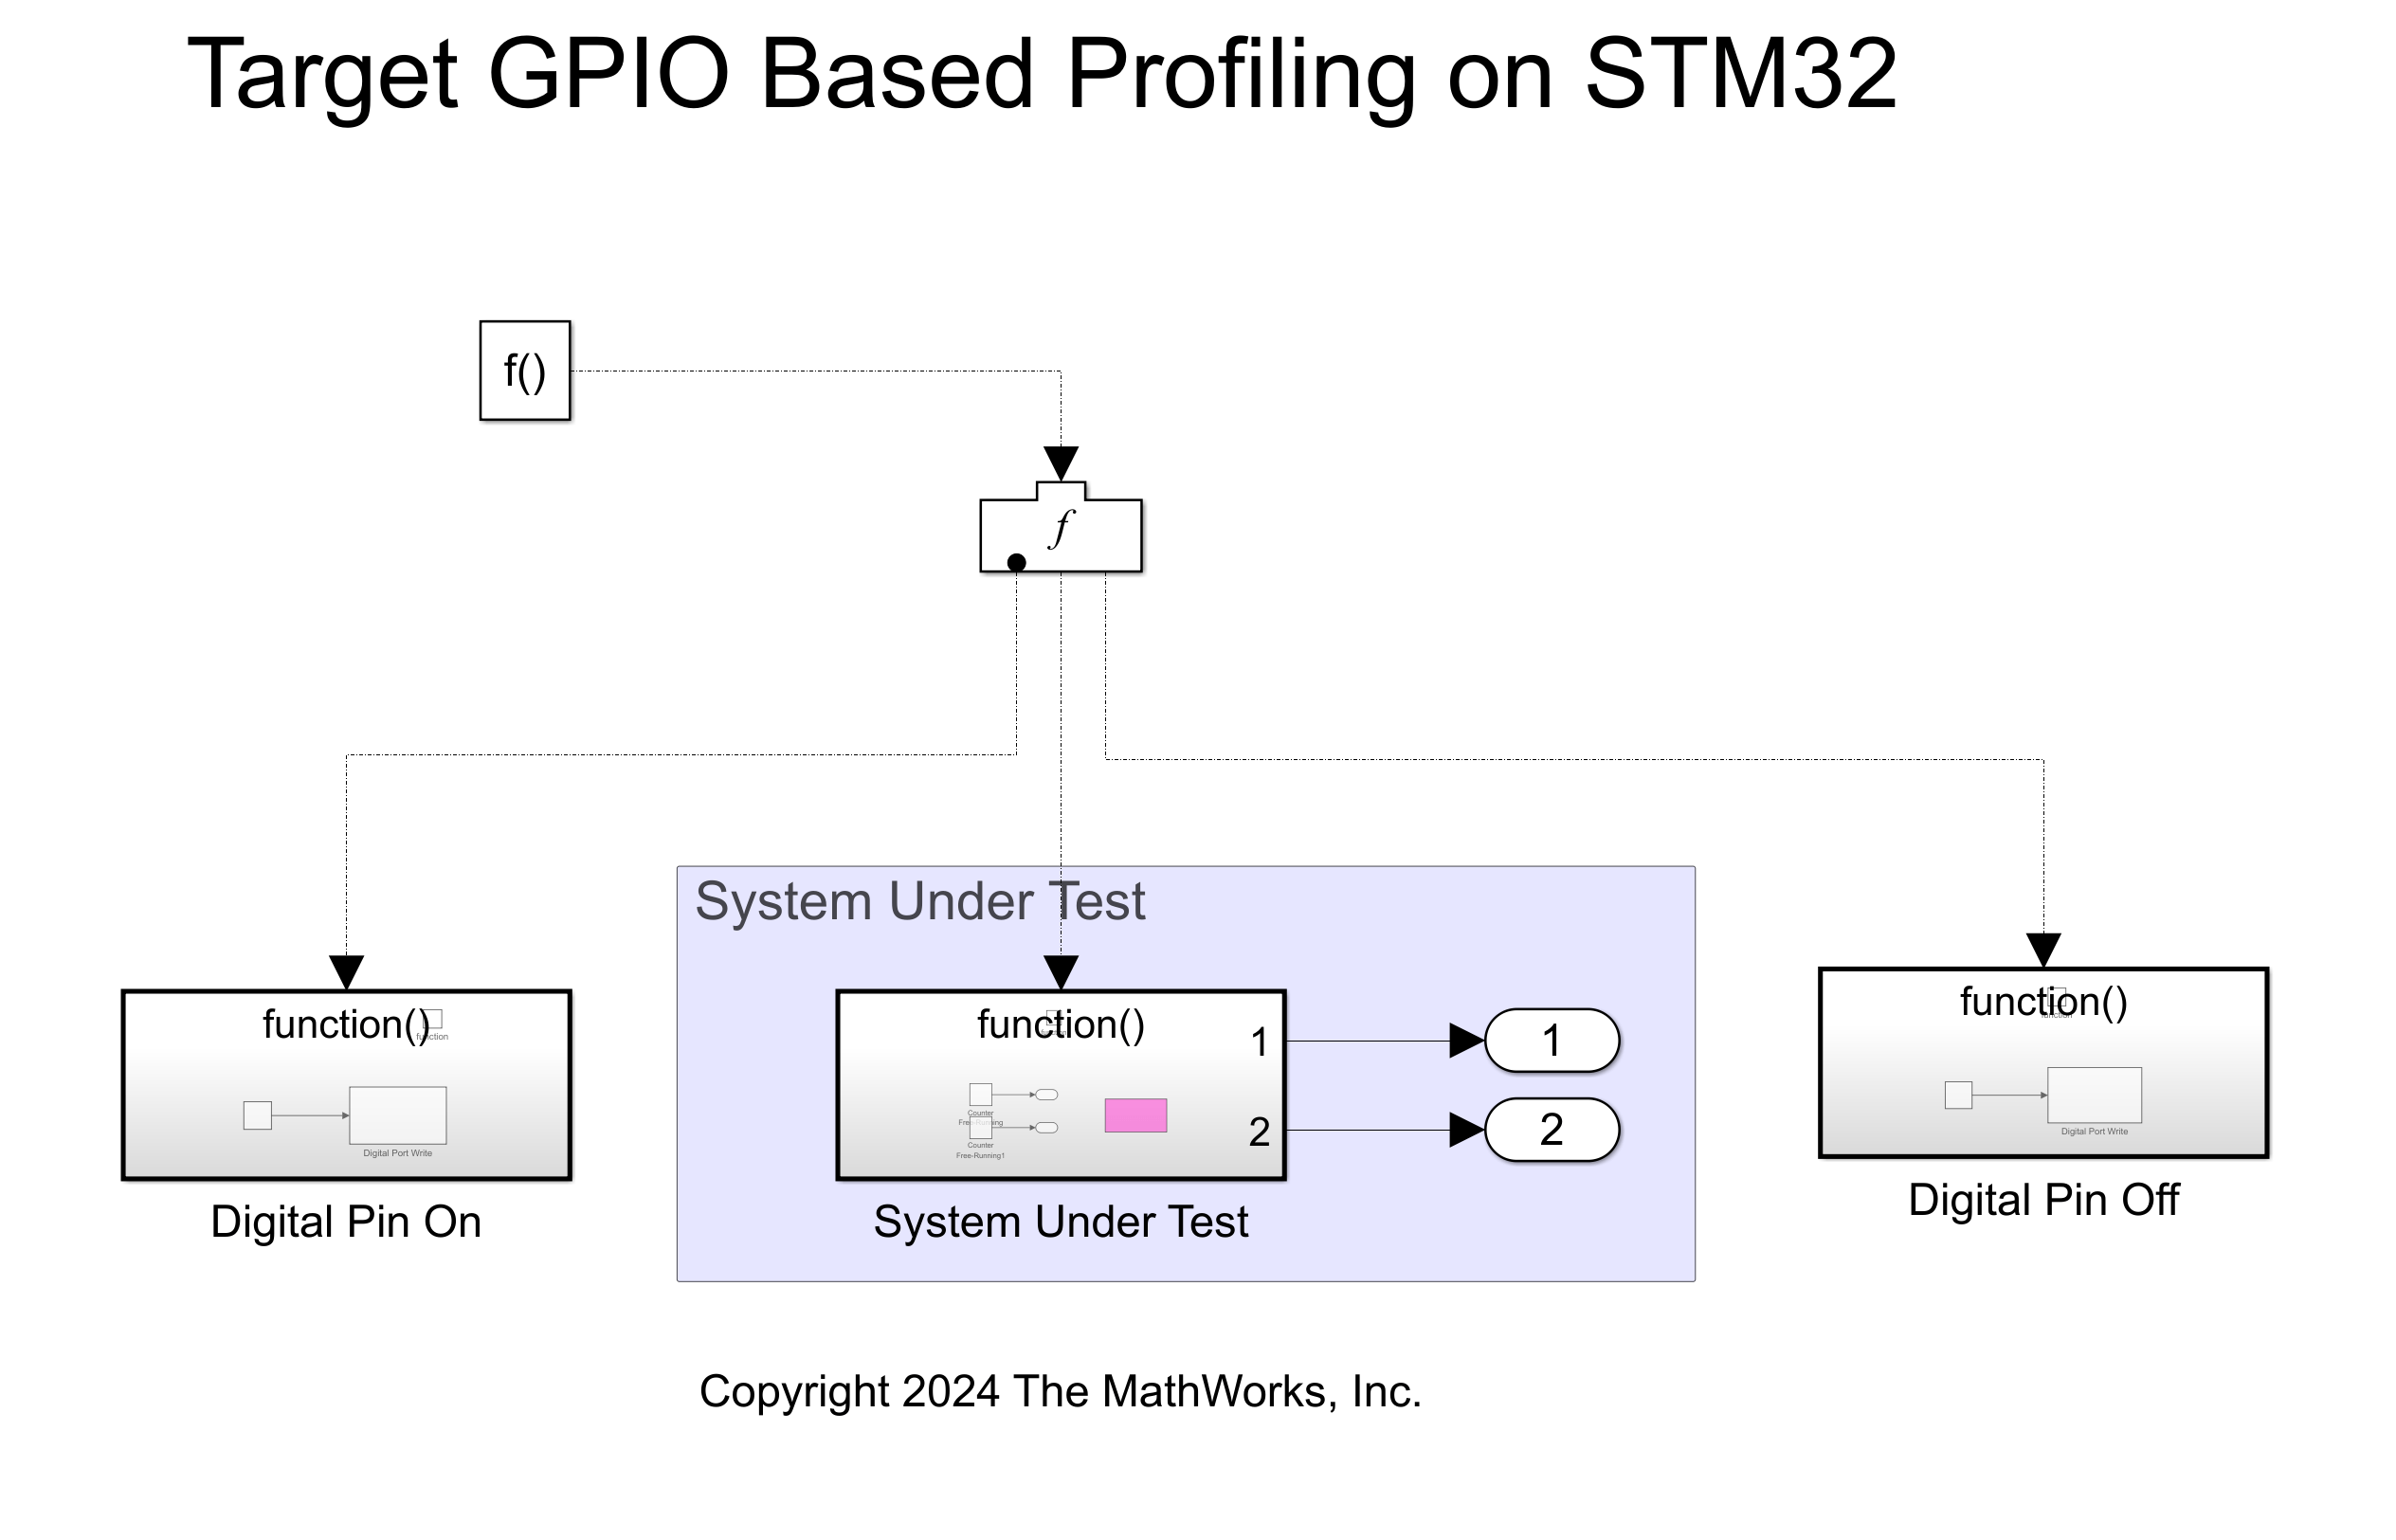
The model consists of three subsystems:
Digital Pin On: Sets a selected GPIO pin to high.
System Under Test: The subsystem to be profiled is placed inside this subsystem.
Digital Pin Off: Sets a selected GPIO pin to low.
You can measure the execution time of the System Under Test subsystem by monitoring the duration the GPIO pin remains in the high state.
Peripheral Configurations
STM32CubeMX Configurations
GPIO Configurations:
Open the
.iocfile associated with your project in STM32CubeMX.Select a GPIO pin according to your requirements and configure it for GPIO Output.
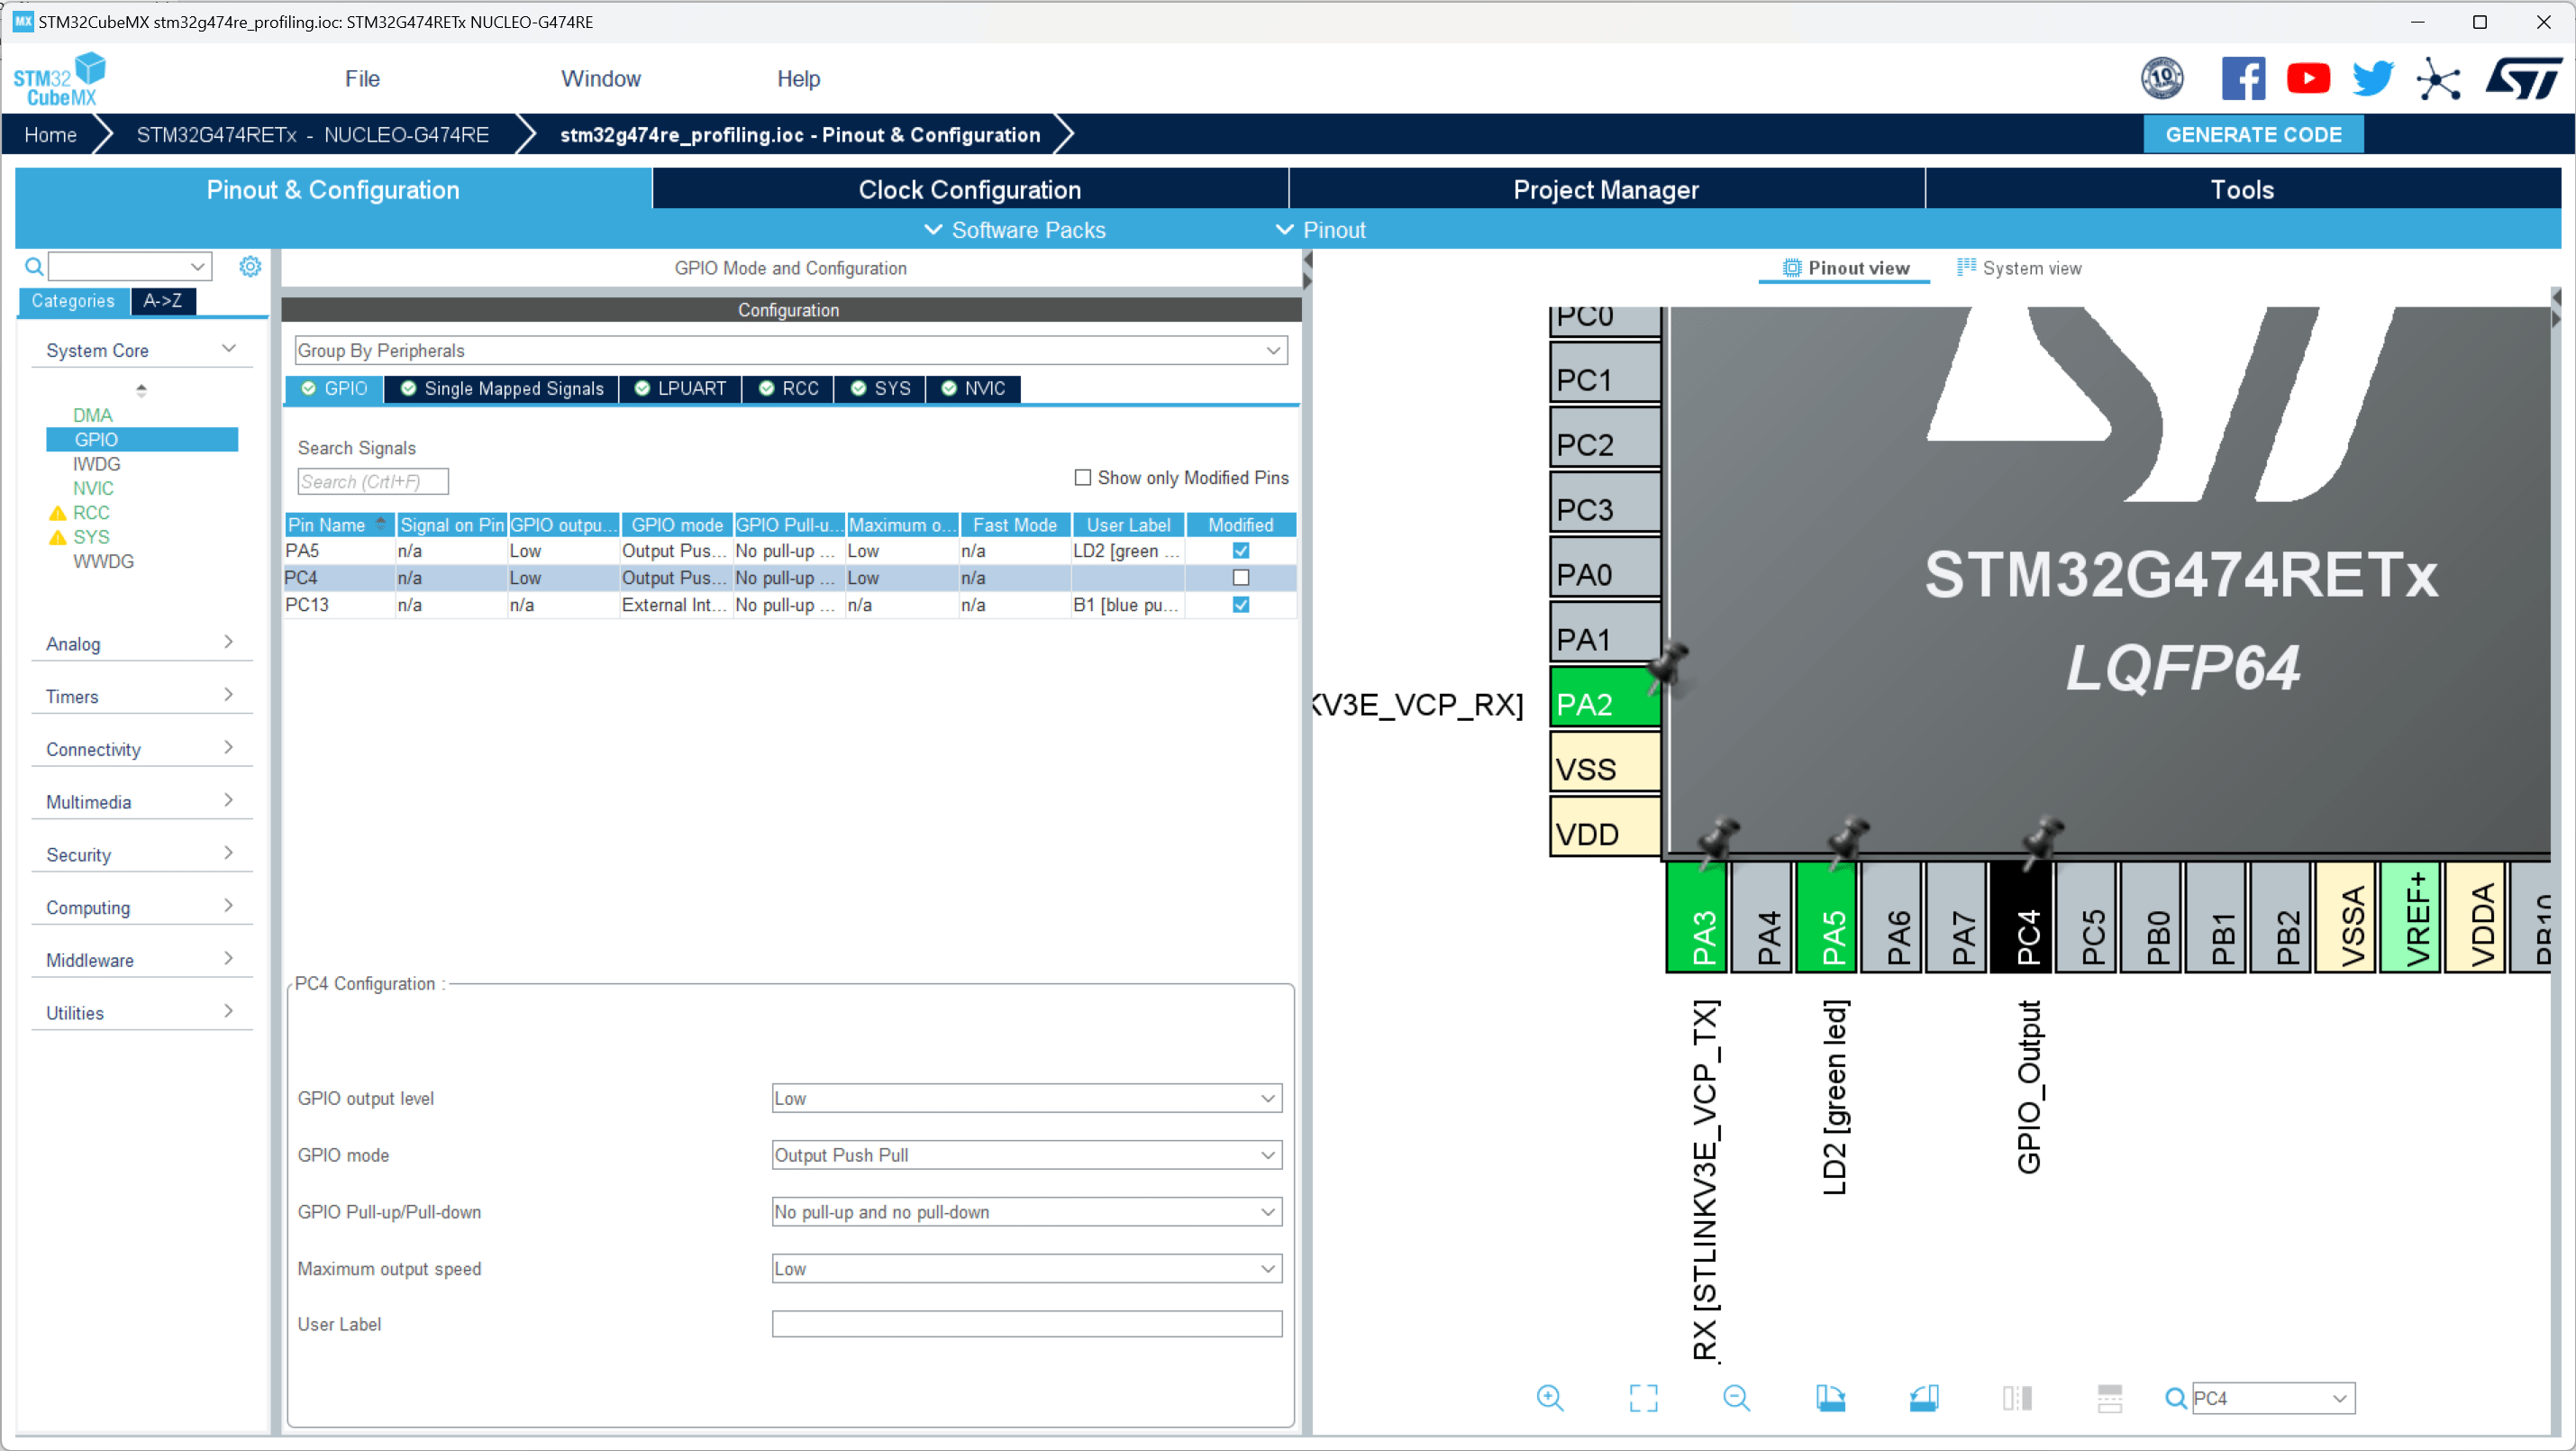
3. Set the Maximum Output Speed parameter to a higher value based on the subsystem's call rate.
Model Configurations
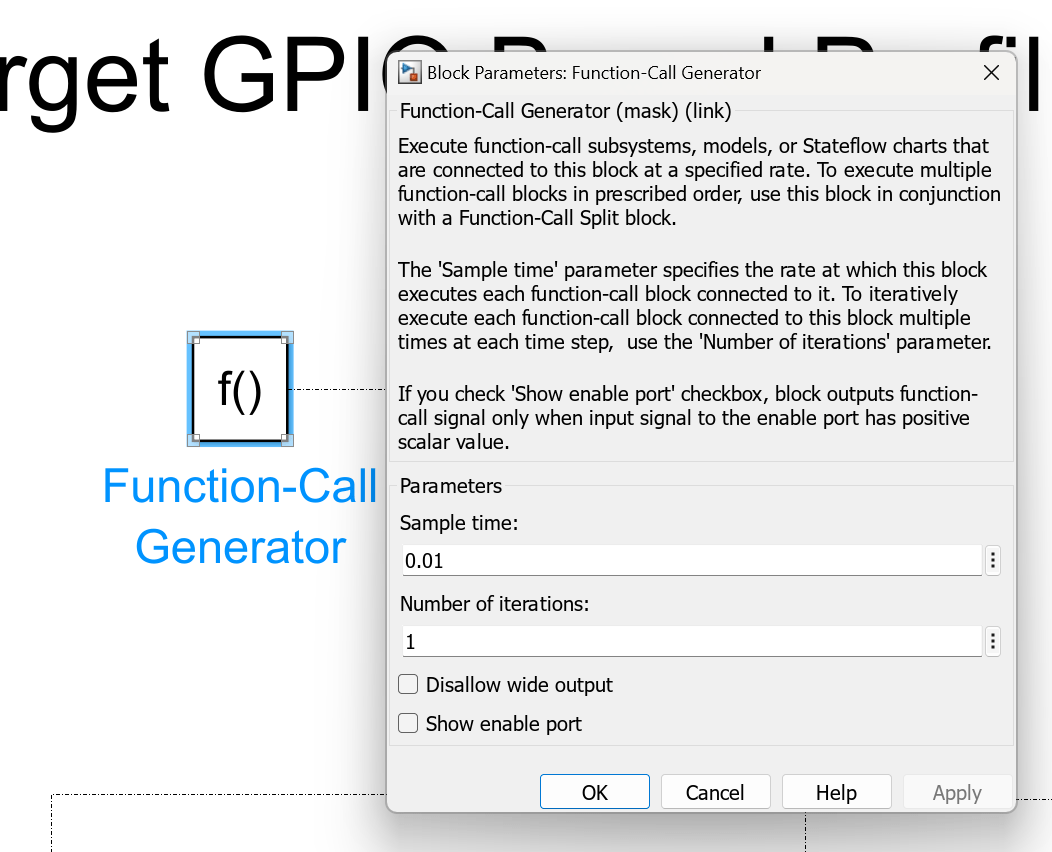
Configure Sample Time: Set the Function-Call Generator's sample time to match the algorithm's original trigger rate, ensuring accurate profiling intervals.
Integrate Function for Profiling: Incorporate the function to be profiled within a designated function-call subsystem, such as the System Under Test in the provided example model.
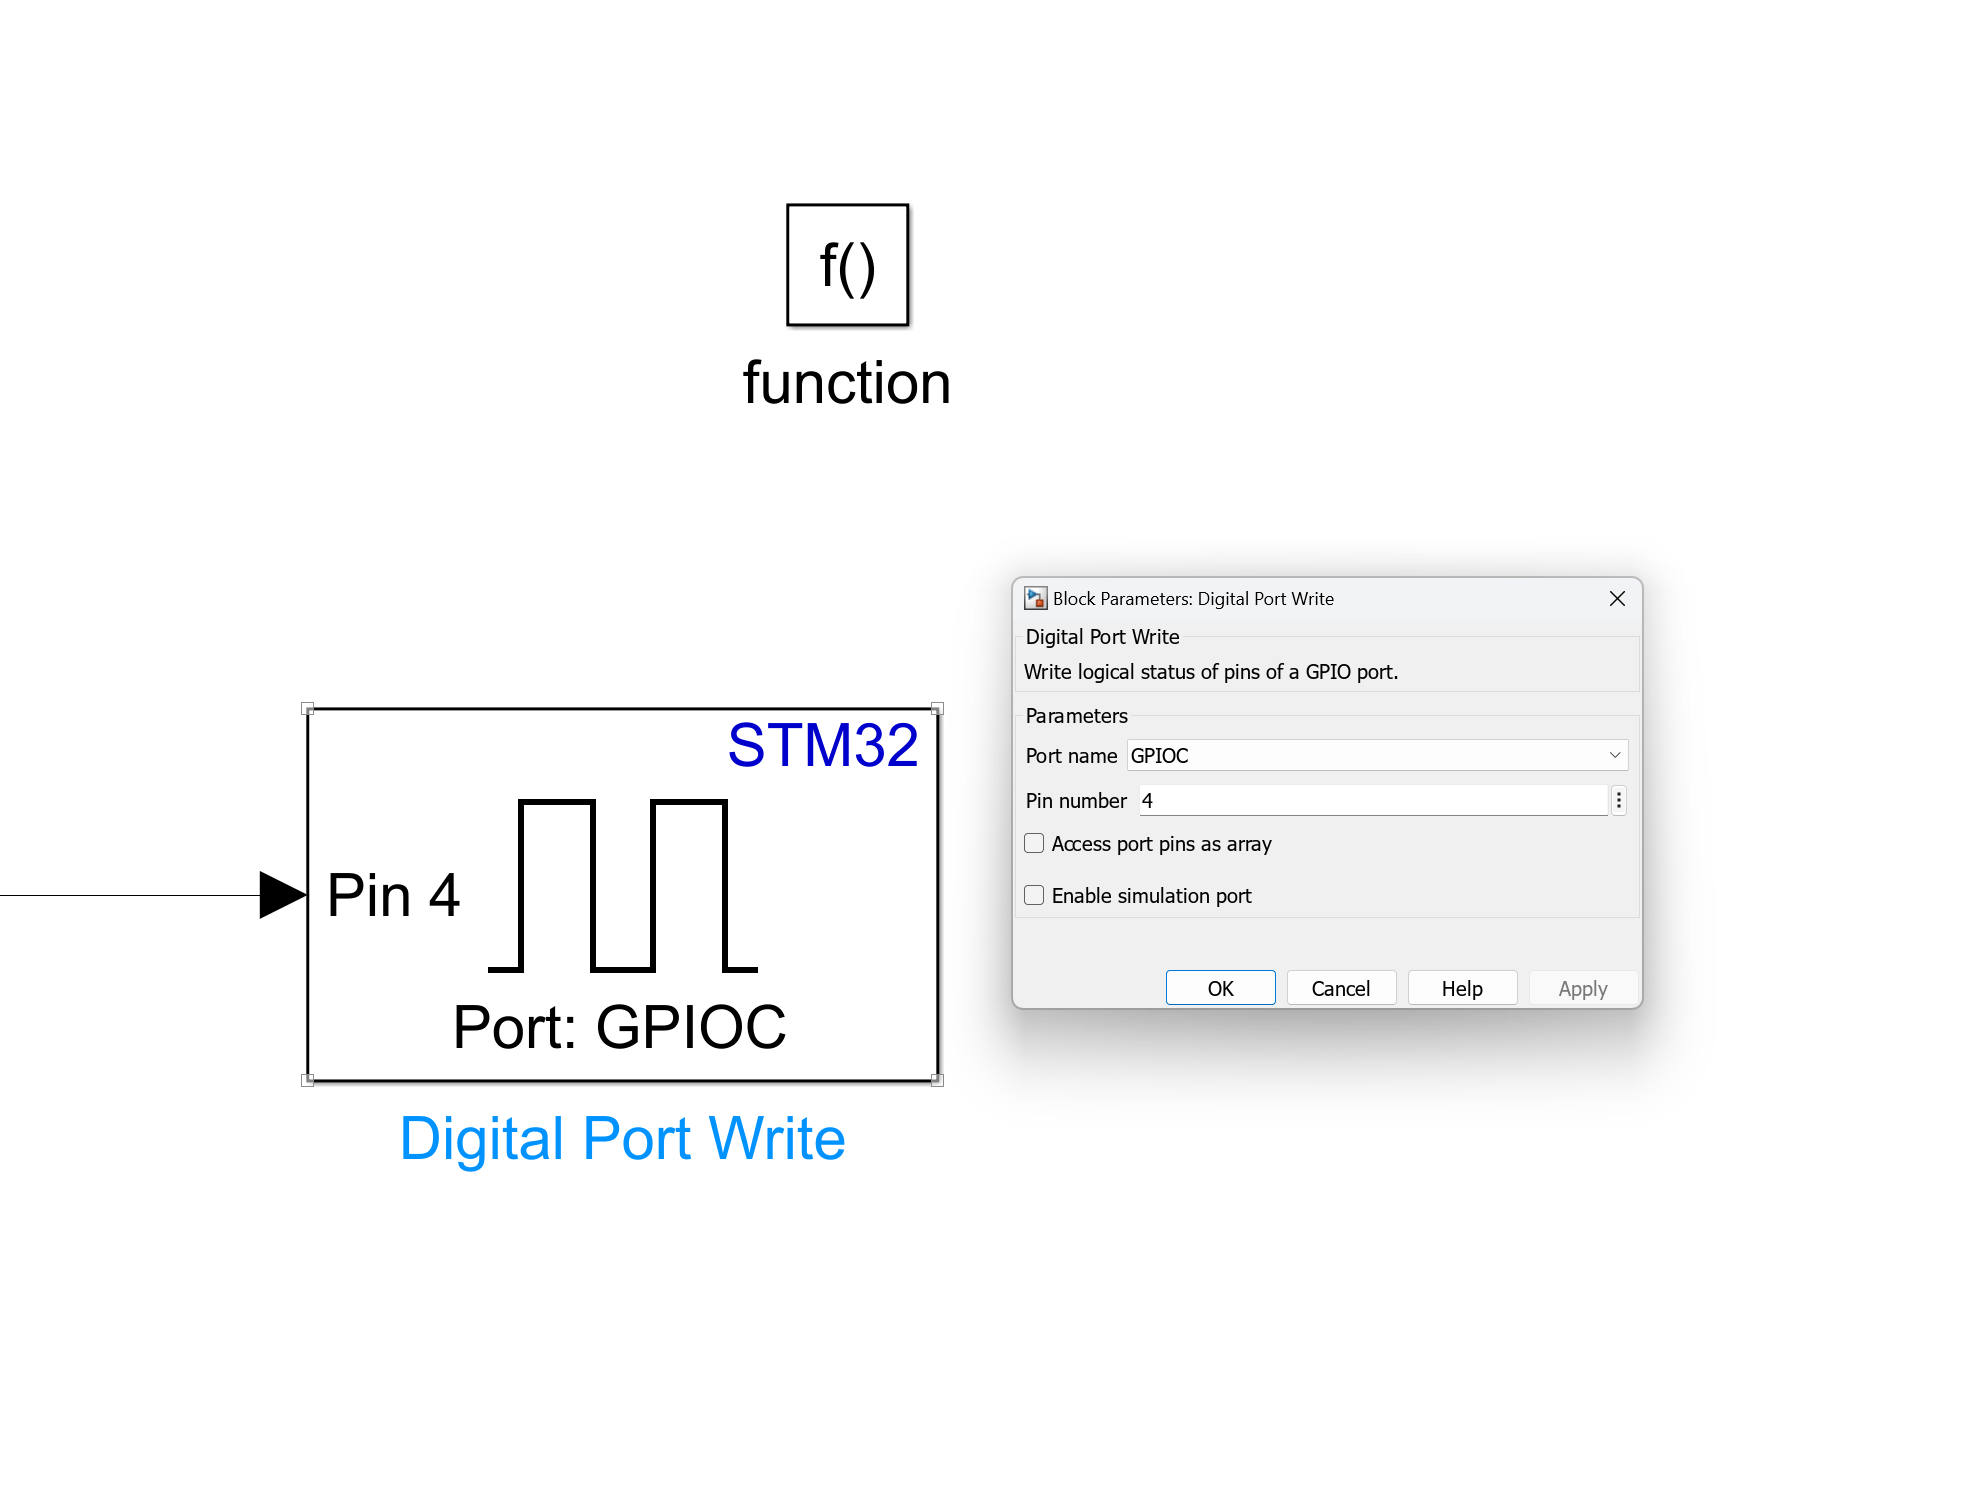
Adjust GPIO Configurations: Customize Digital Port Write blocks within Digital Pin On and Digital Pin Off subsystems to align with the GPIO pin settings configured in the STM32CubeMX
.iocfile.
Connect a DSO to the GPIO pin.
Click on Build, Deploy, and Start.
Observe the output and measure the width of the positive pulse to determine the execution time.
Note:
This example focuses on synchronous subsystems. For profiling asynchronous subsystems, see Profiling Motor Control Algorithms.
A 2-millisecond delay is introduced with the block being profiled, so the Execution Time is
0.0020in the final output.
Timer Based Profiling
Available Models
You can use the stm32_timer_based_profiling_target.slx model for code generation. The stm32_timer_based_profiling_host.slx is run in simulation and communicates with the target board to fetch profiling counts. You can also use open_system command to open the Simulink® models. For example, use this command for a STM32 Processor based Boards:
open_system('GettingStartedProfilingSTM32/stm32_timer_based_profiling_target');
open_system('GettingStartedProfilingSTM32/stm32_timer_based_profiling_host');
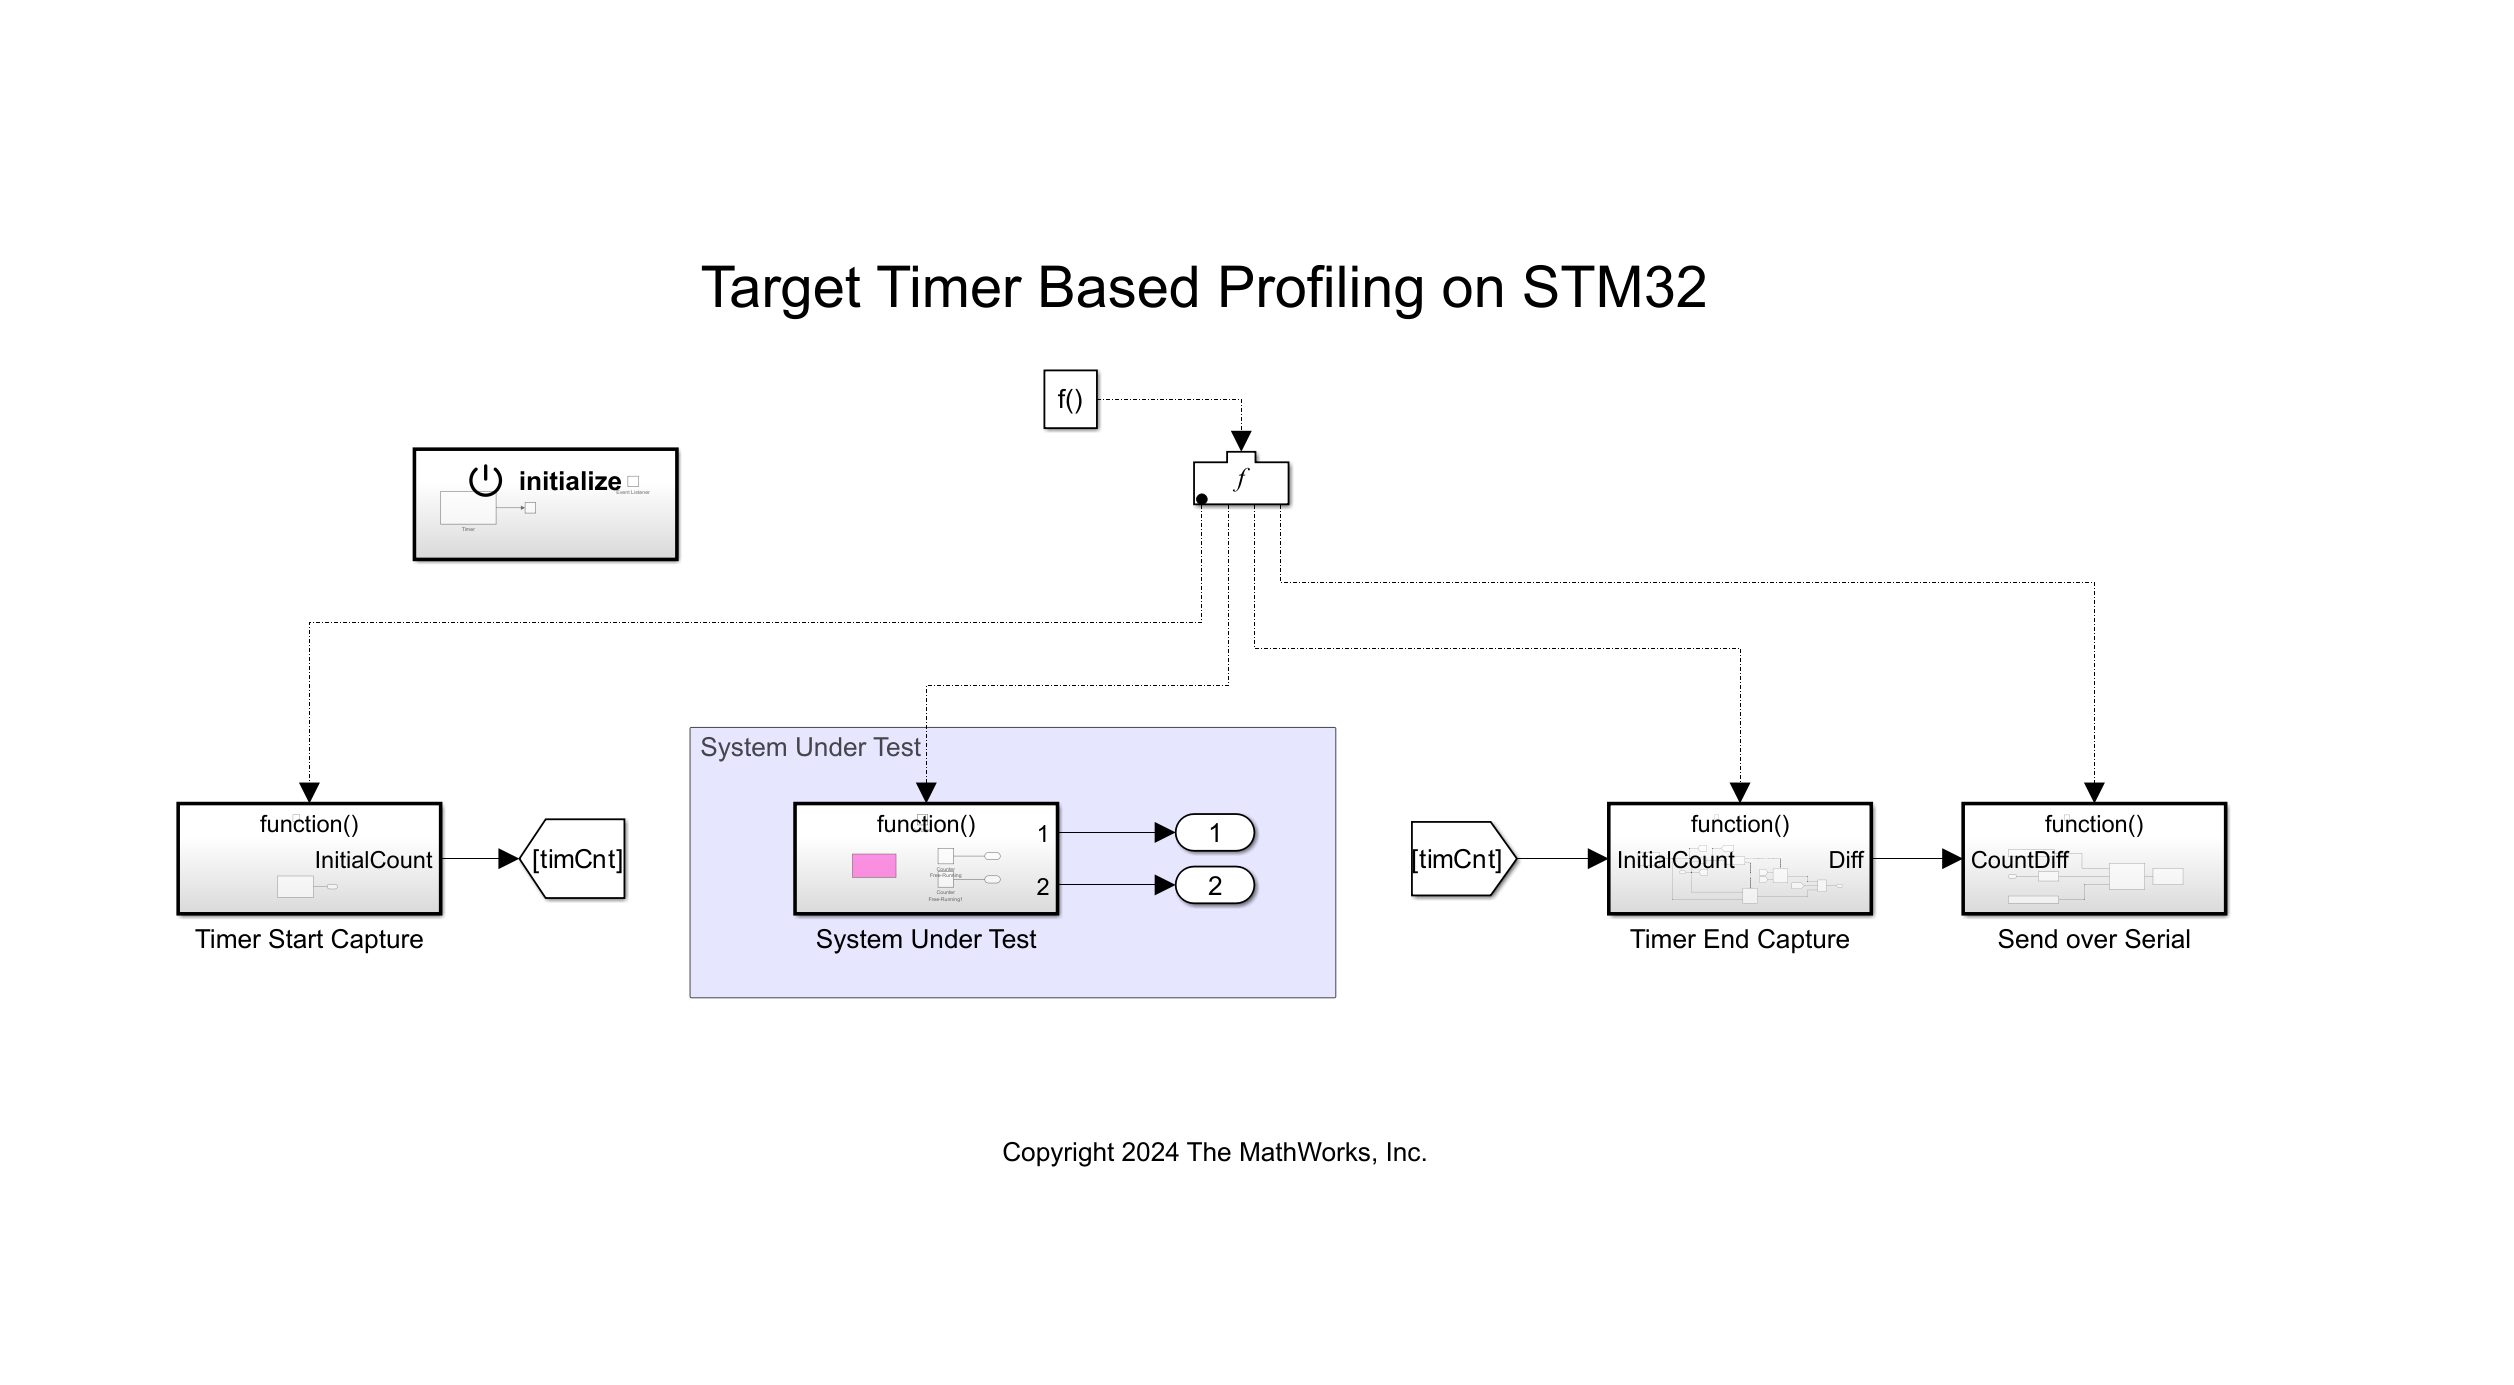
The target model comprises 5 subsystems:
Initialize Function: Initializes the timer for profiling purposes.
Timer Start Capture: Captures the initial timer count.
System Under Test: Contains the subsystem that is being profiled.
Timer End Capture: Captures the timer count again after execution of the System Under Test. Calculates the difference from the initial count.
Send over Serial: Transmits the calculated difference to the host model via serial communication.
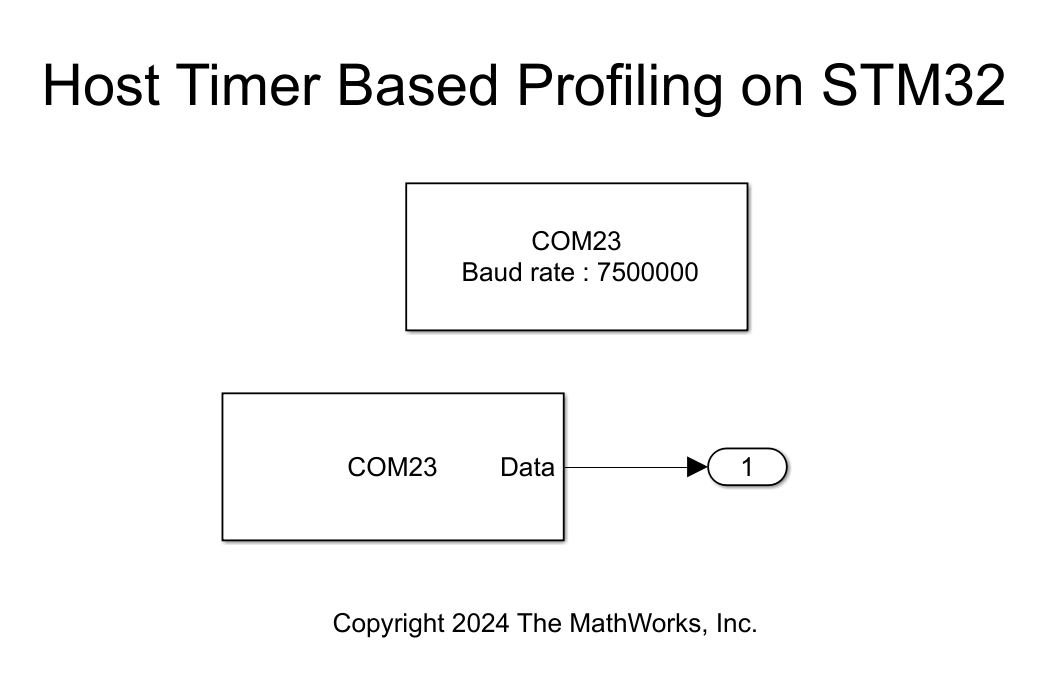
The host model captures and logs incoming serial data from the target model for inspection using the Simulink Data Inspector.
Peripheral Configurations
STM32CubeMX Configurations
Timer Configuration
Configuring the timer in STM32CubeMX is necessary for count capturing. In this example, Timer 2 is used for this purpose.
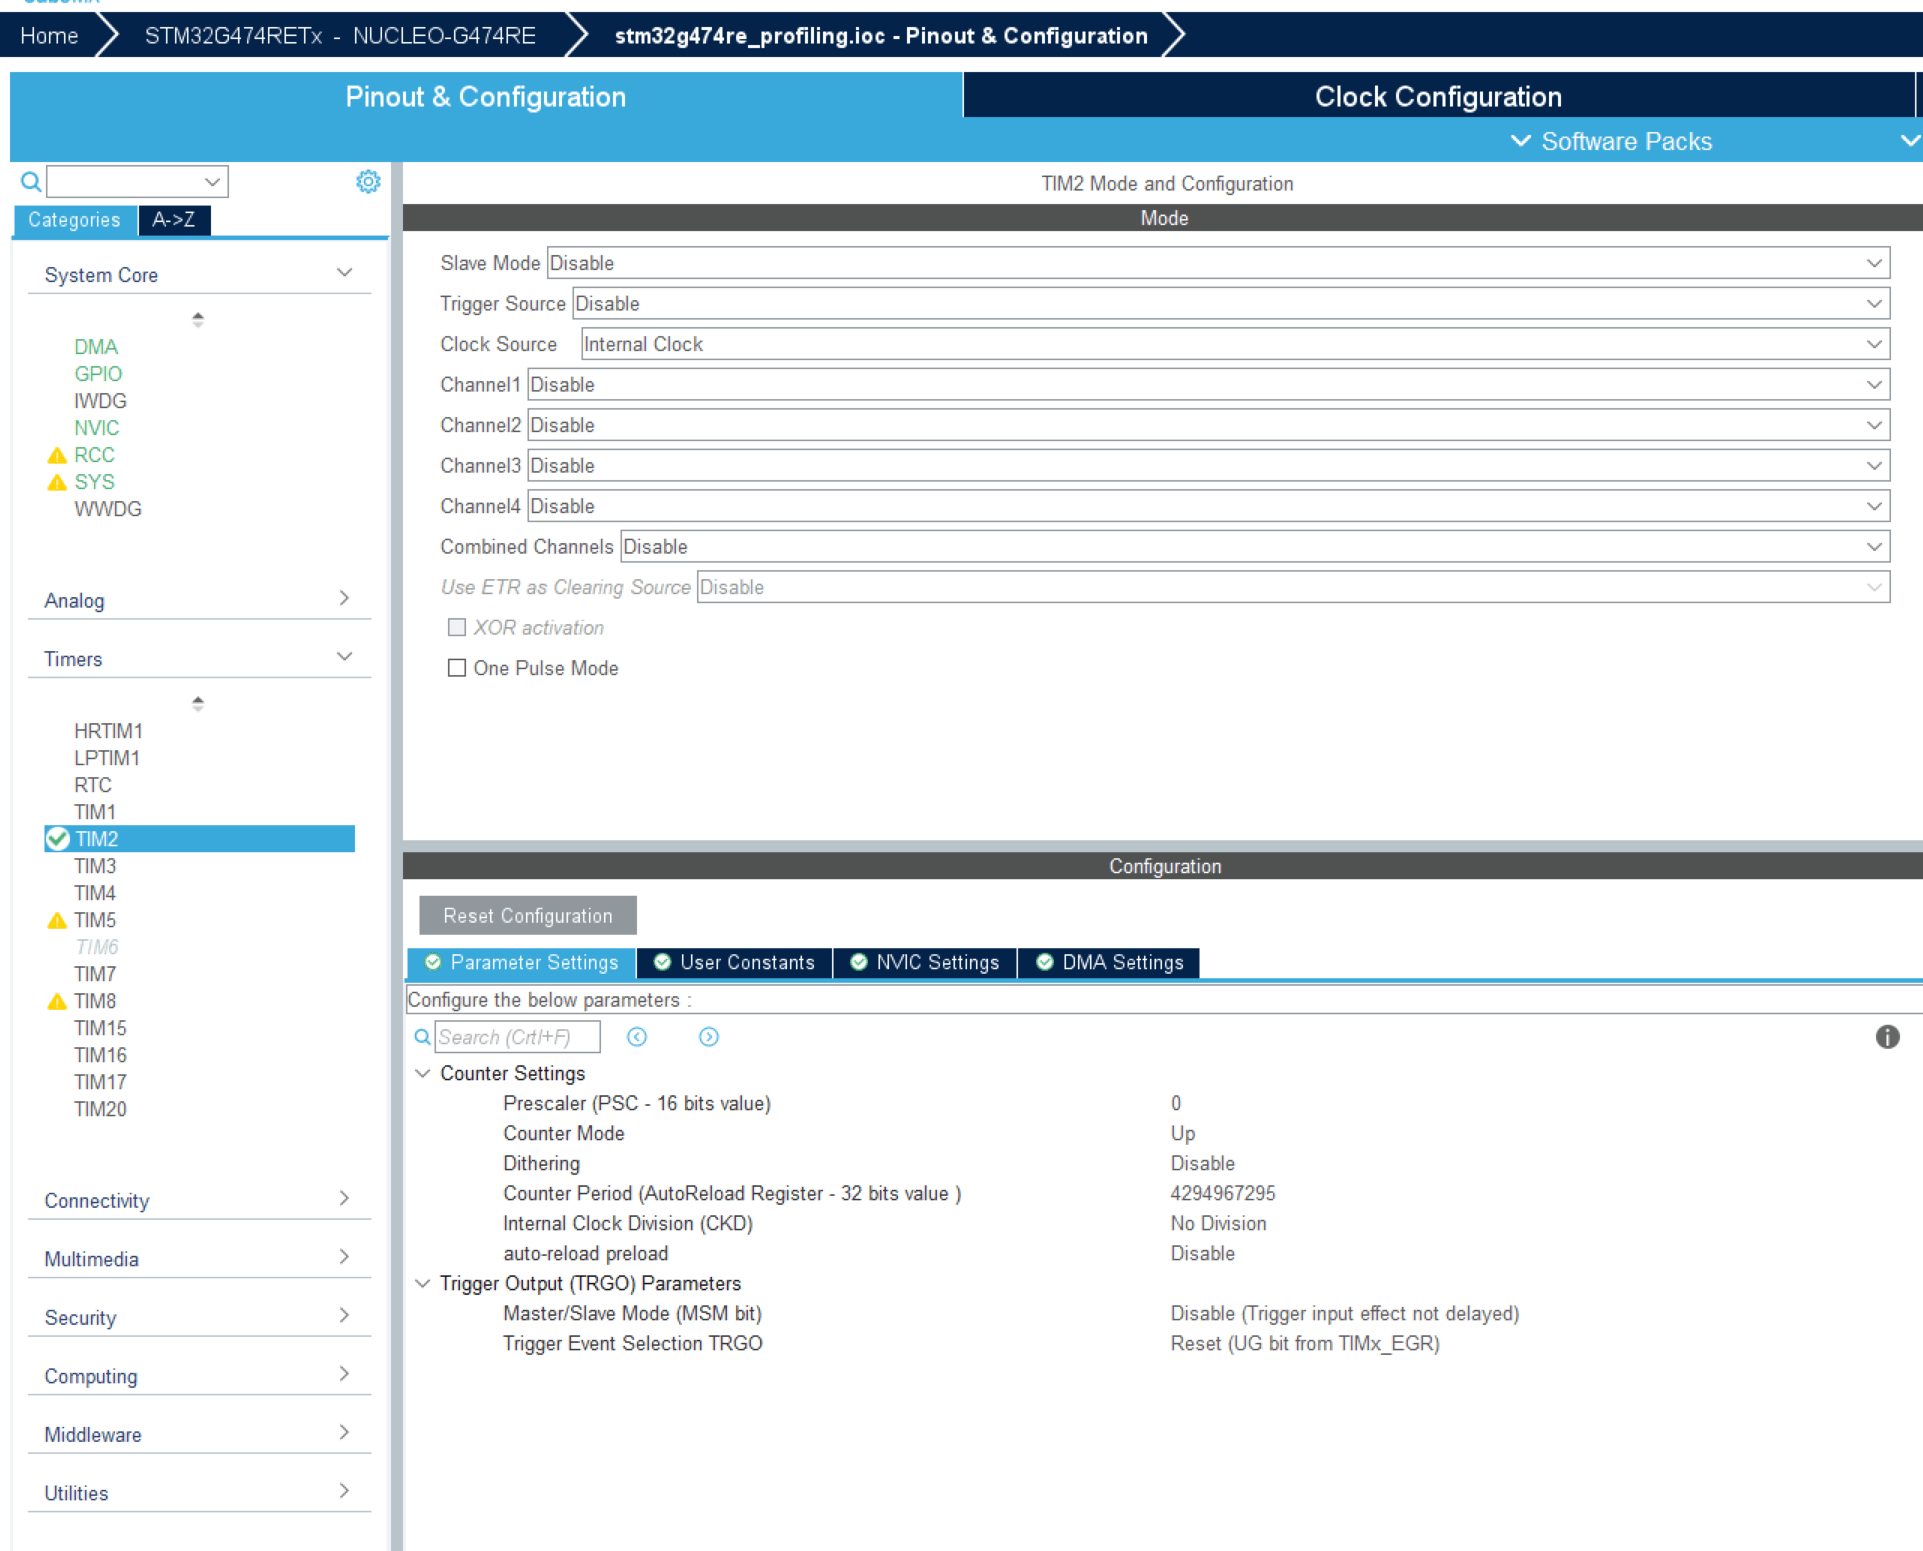
Set the prescaler value to 0 and configure the counter period to the maximum 32-bit value.
Using a 32-bit timer for profiling is preferred because it accommodates longer tasks without overflow issues; a 16-bit timer may lead to inaccurate readings due to potential overflow.
If a 32-bit timer is designated as the timebase source in the 'SYS' tab, consider using a Basic Timer (such as Timers 6 or 7) instead. This frees up a 32-bit timer for profiling or other application-related tasks. The timebase source is primarily used for delays and timeouts, which do not necessitate advanced capabilities.
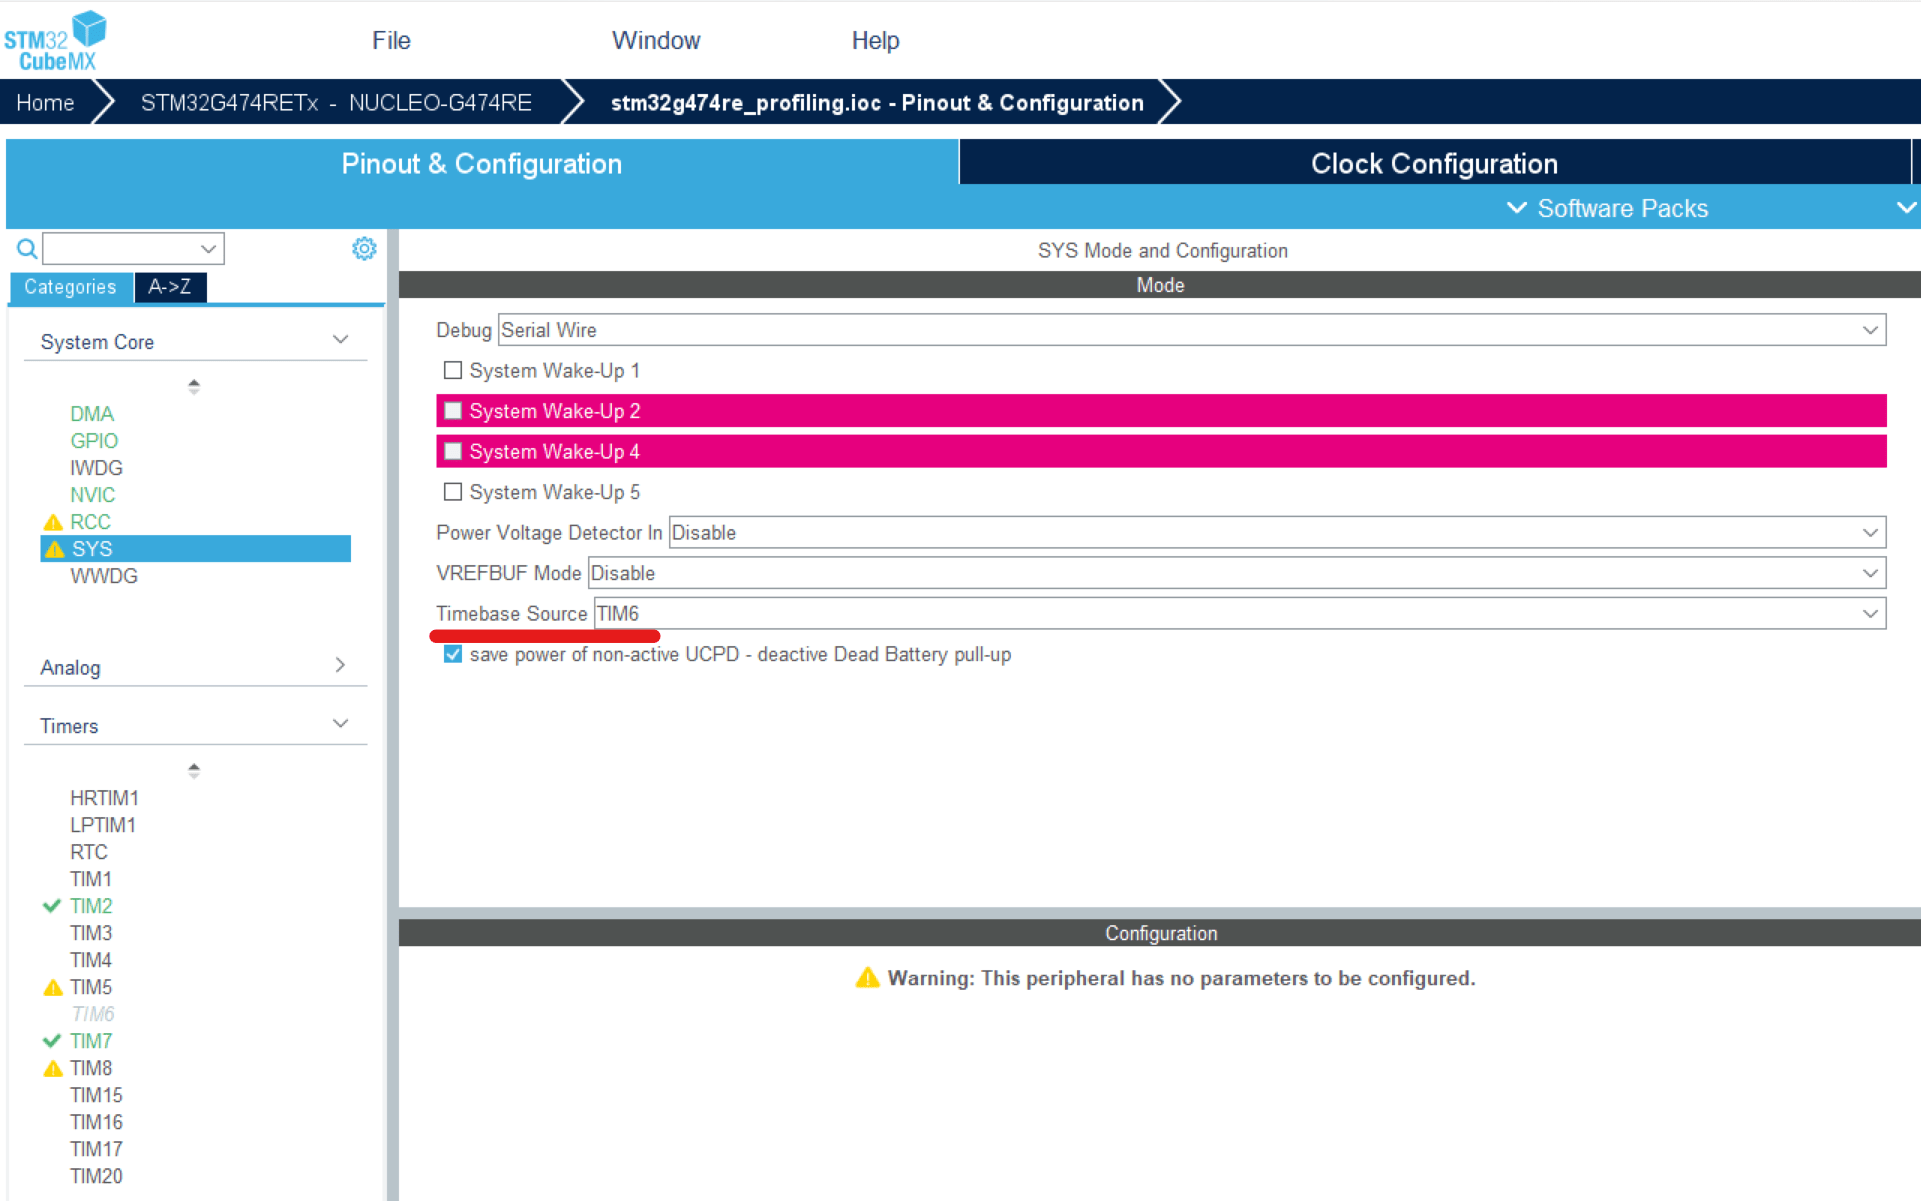
Make sure that the timer configured for profiling is exclusively dedicated to profiling and not utilized within the application itself to avoid inaccurate count readings.
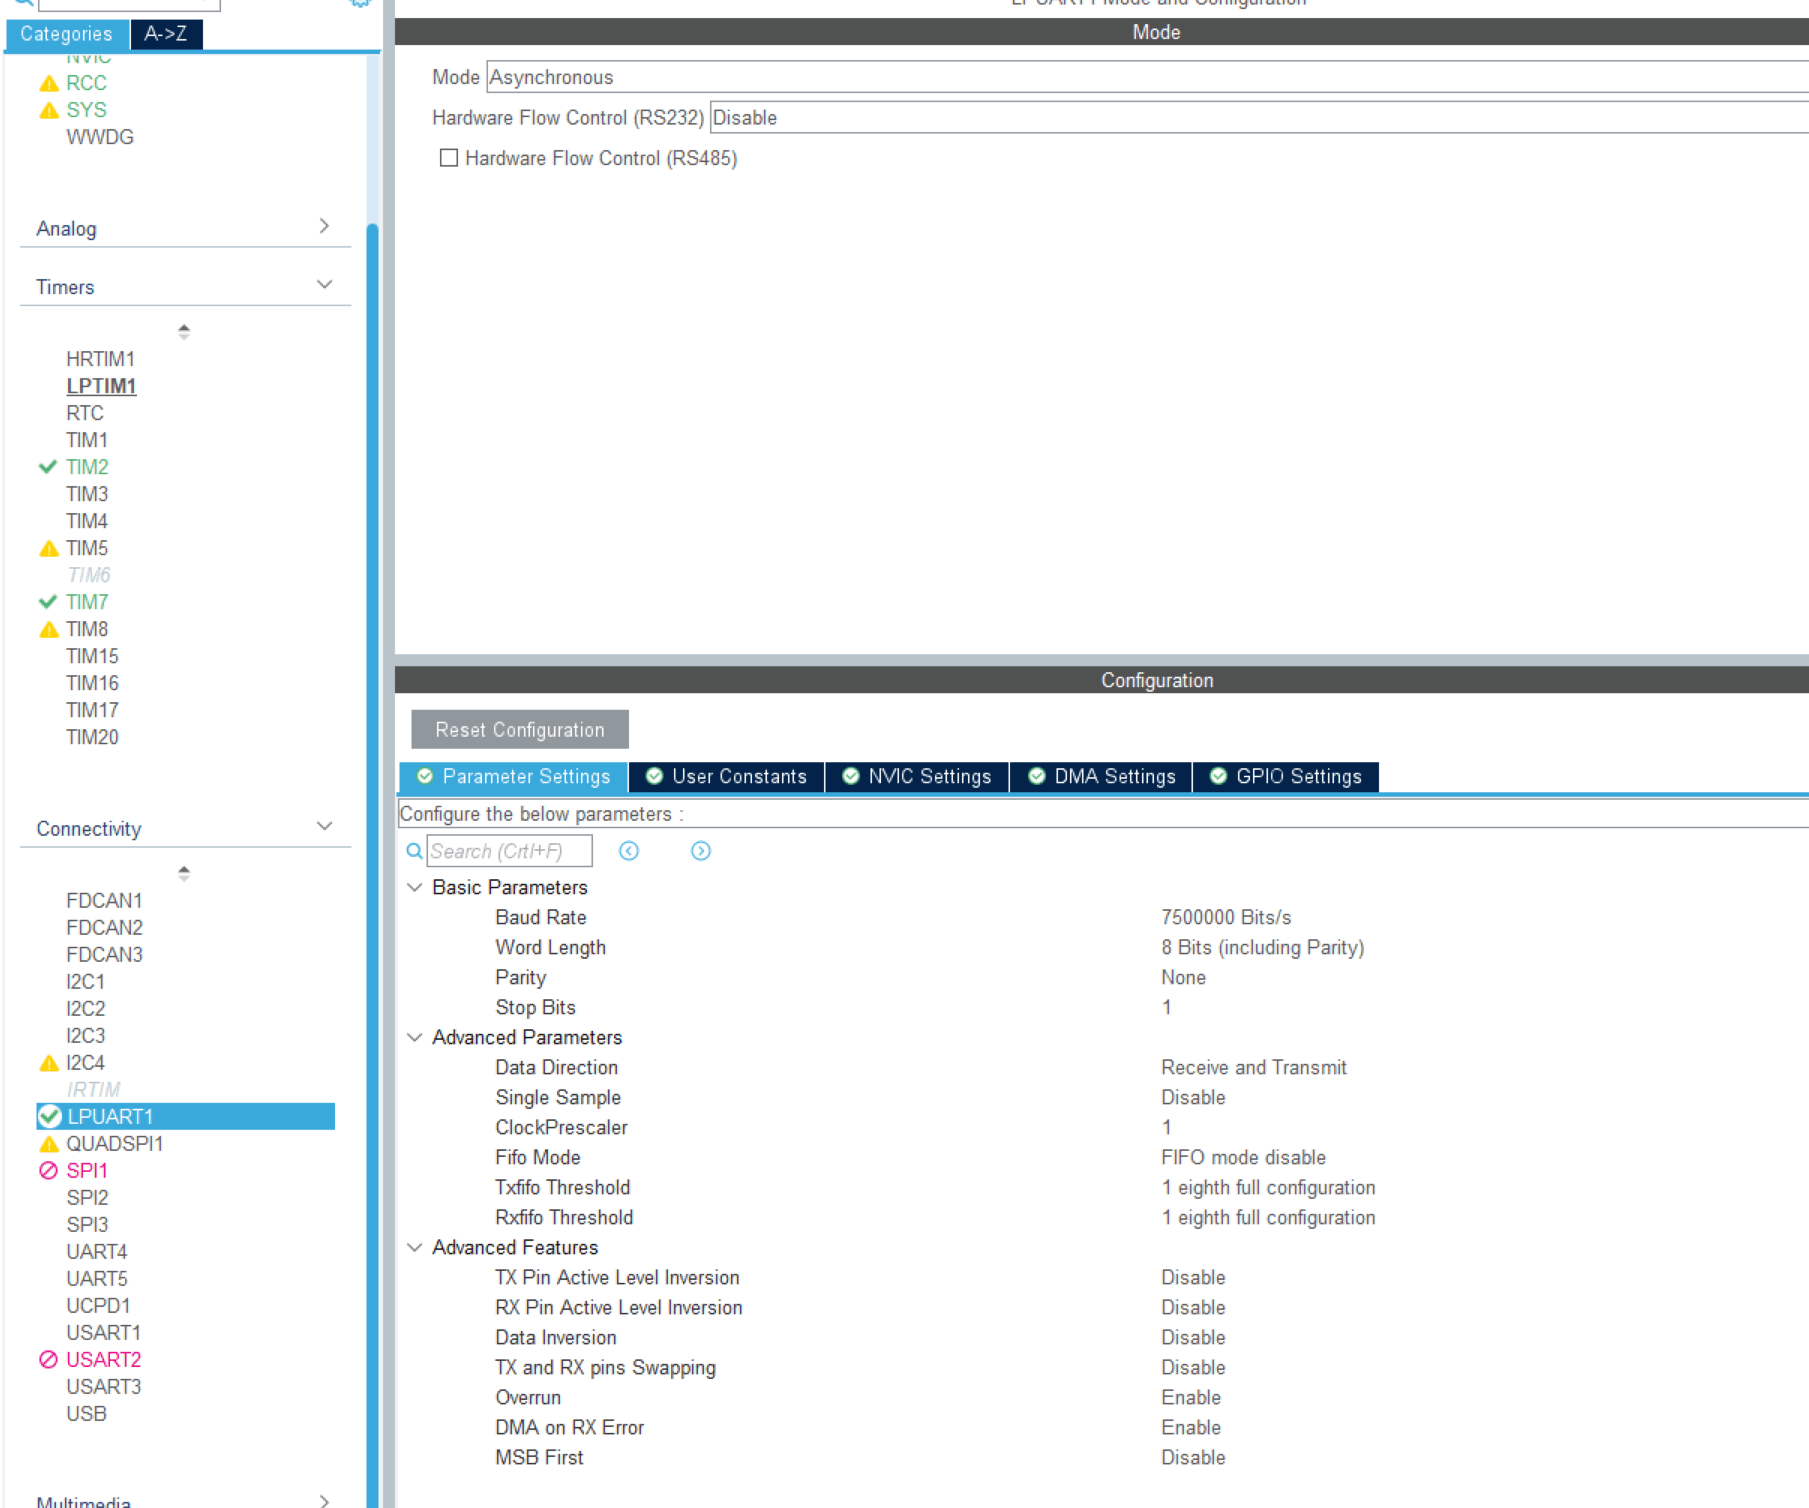
USART Configuration
To facilitate the two-model approach, configure a USART/UART module for serial communication.
This example utilizes the LPUART1 module on the STM32G474RE Nucleo Board.
Peripheral Block Configuration
Double-click the blocks to open their block parameter configurations. Ensure that the timer module used in the Initialize Function, Timer Start Capture, and Timer End Capture subsystems matches the one configured for profiling in STM32CubeMX.
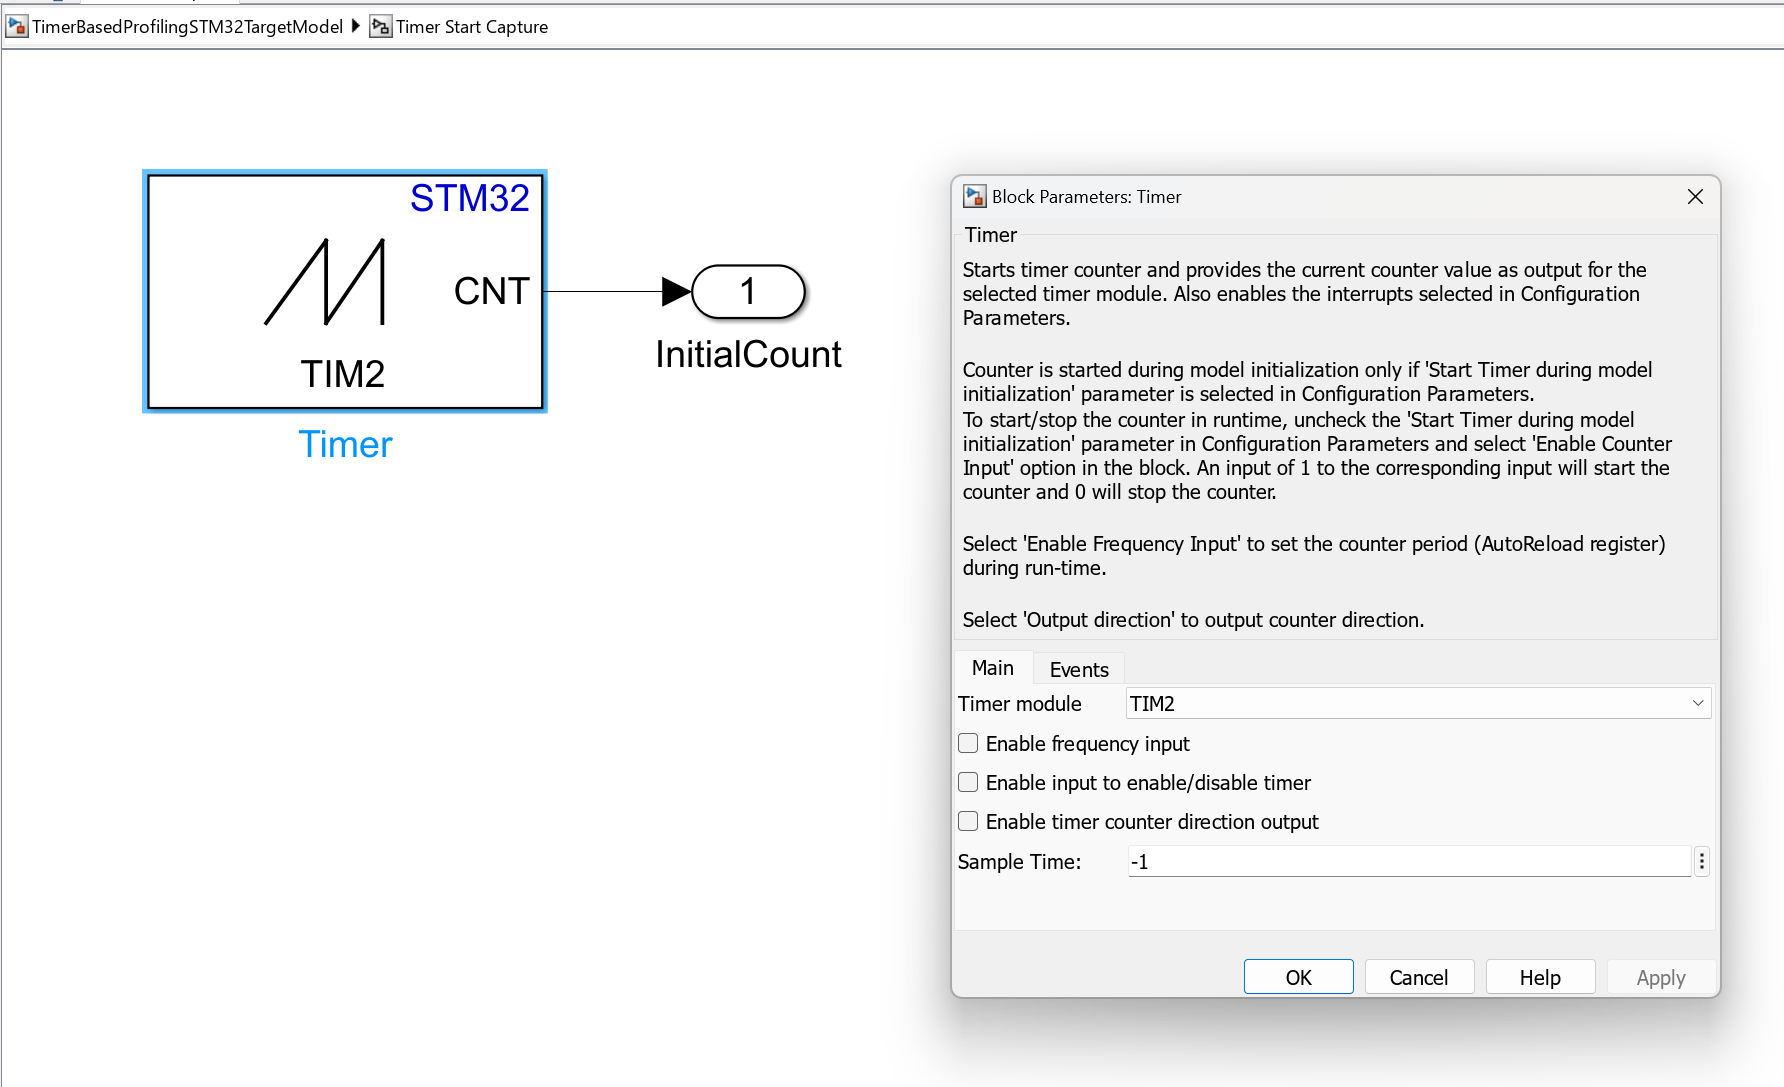
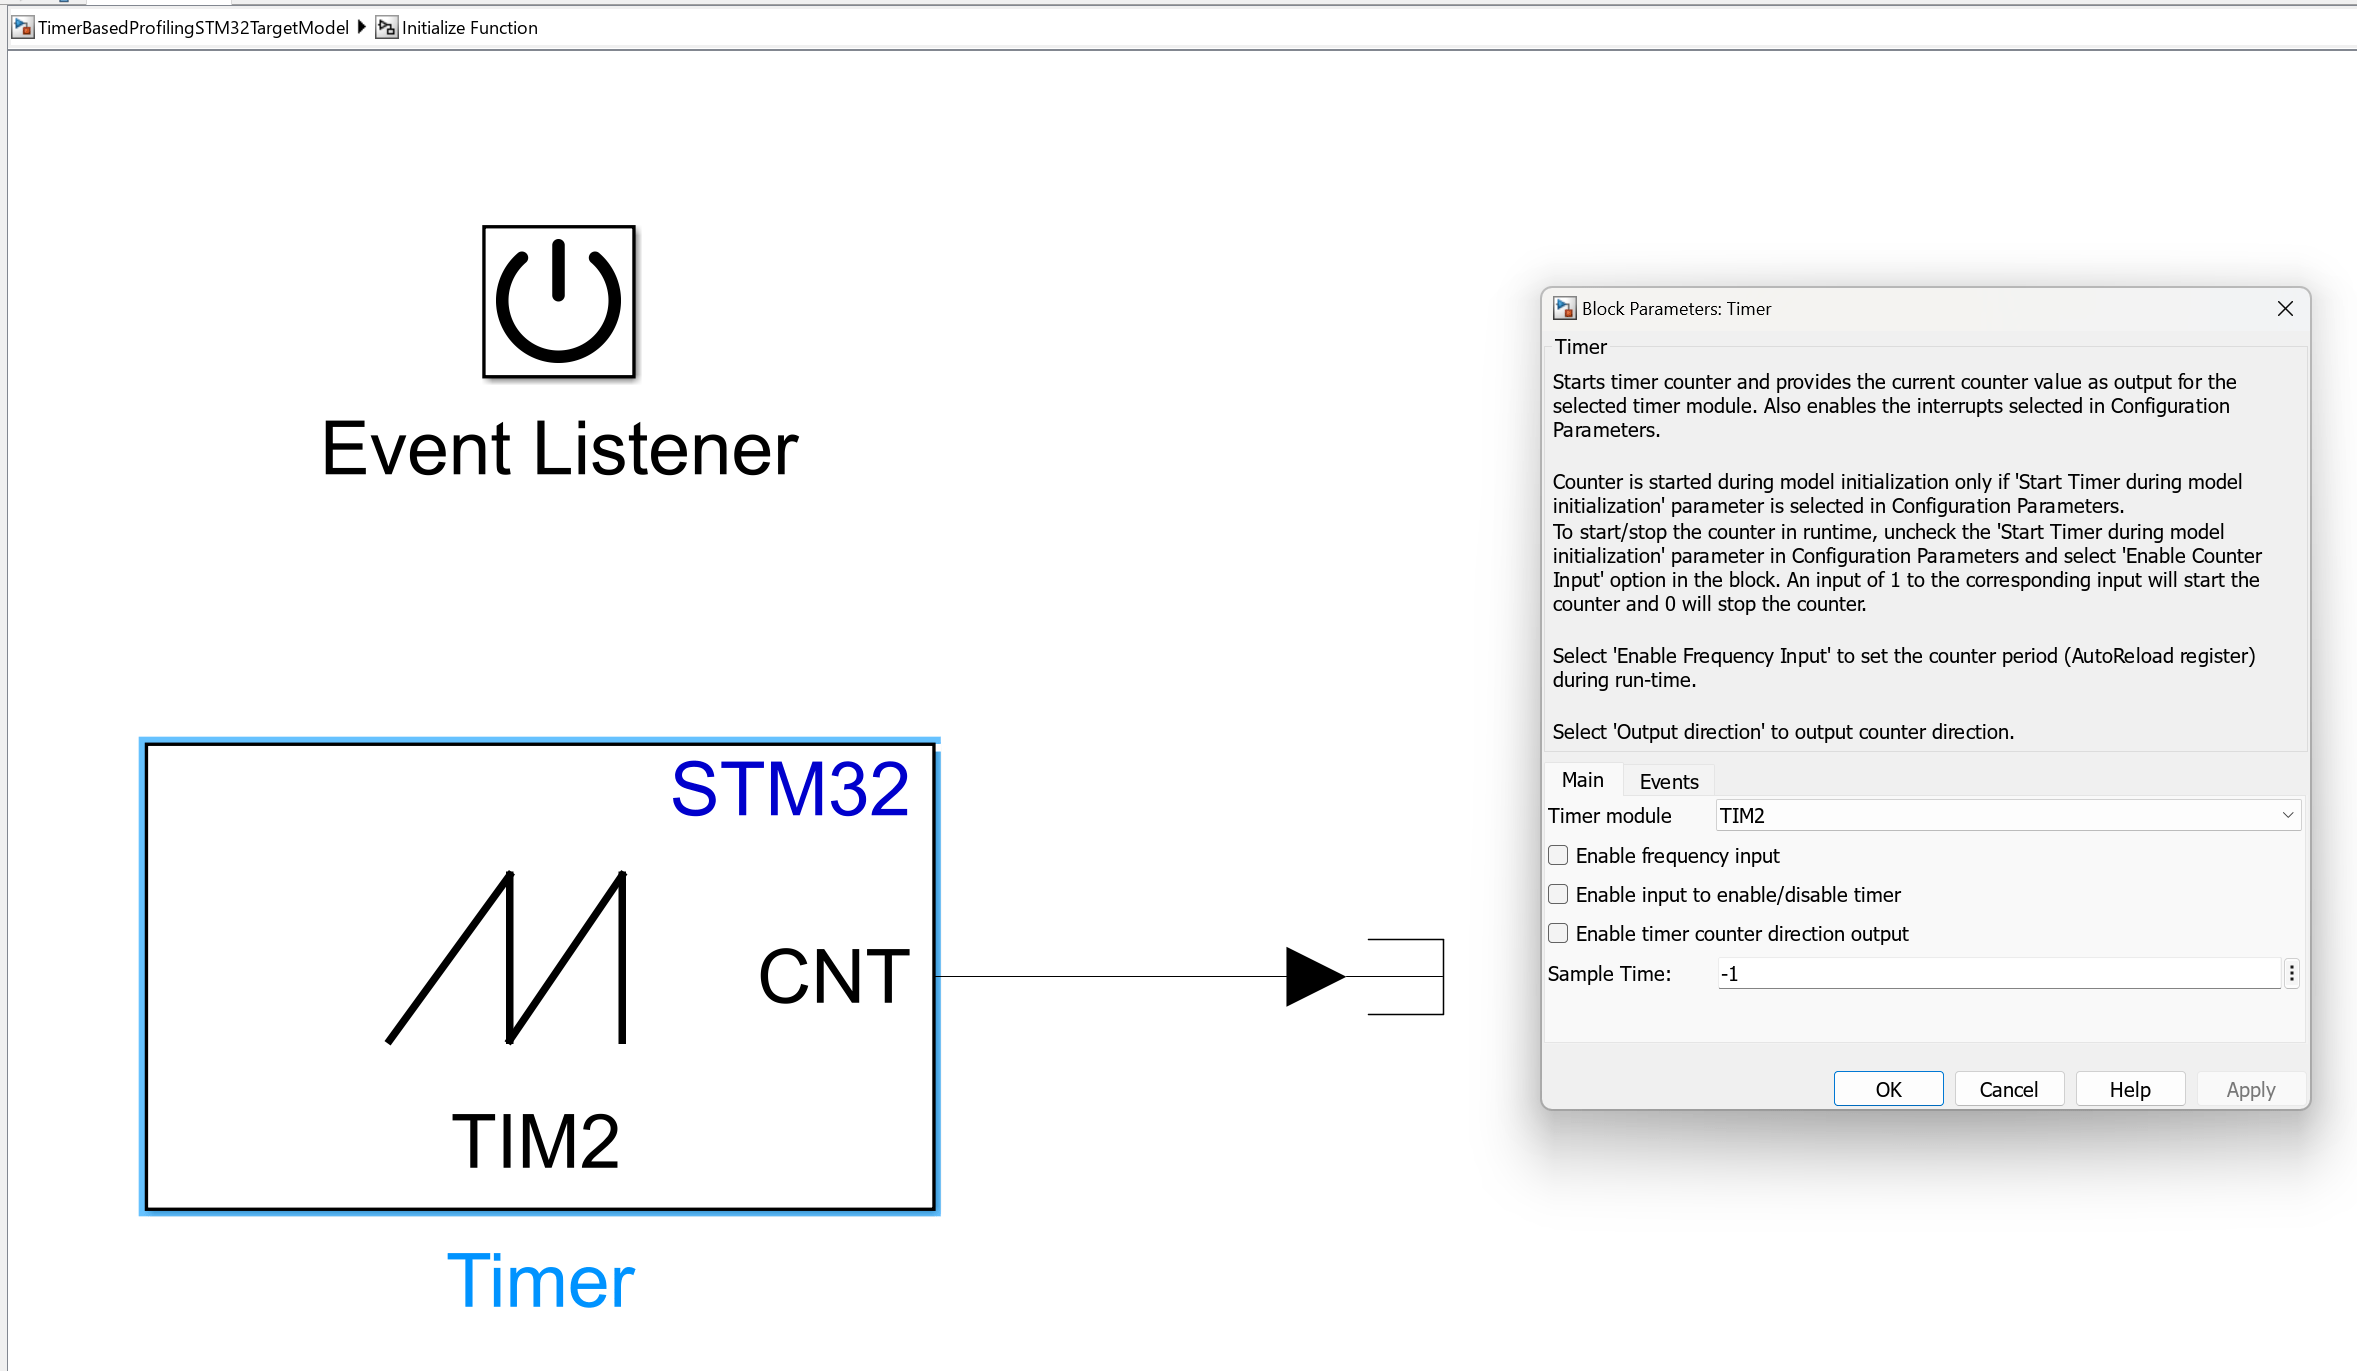
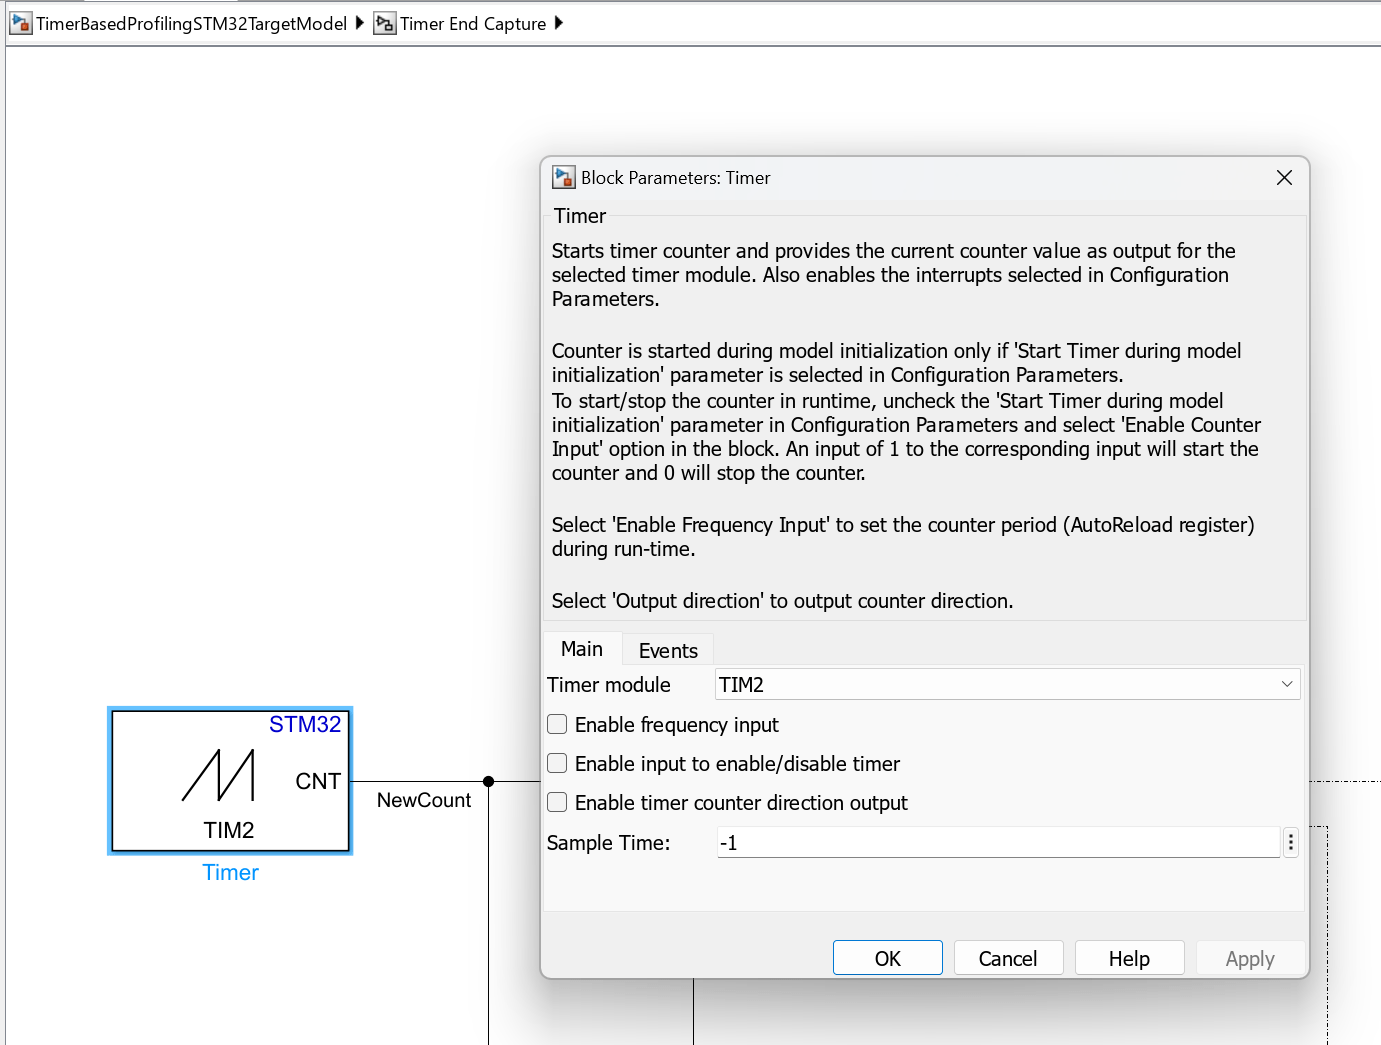
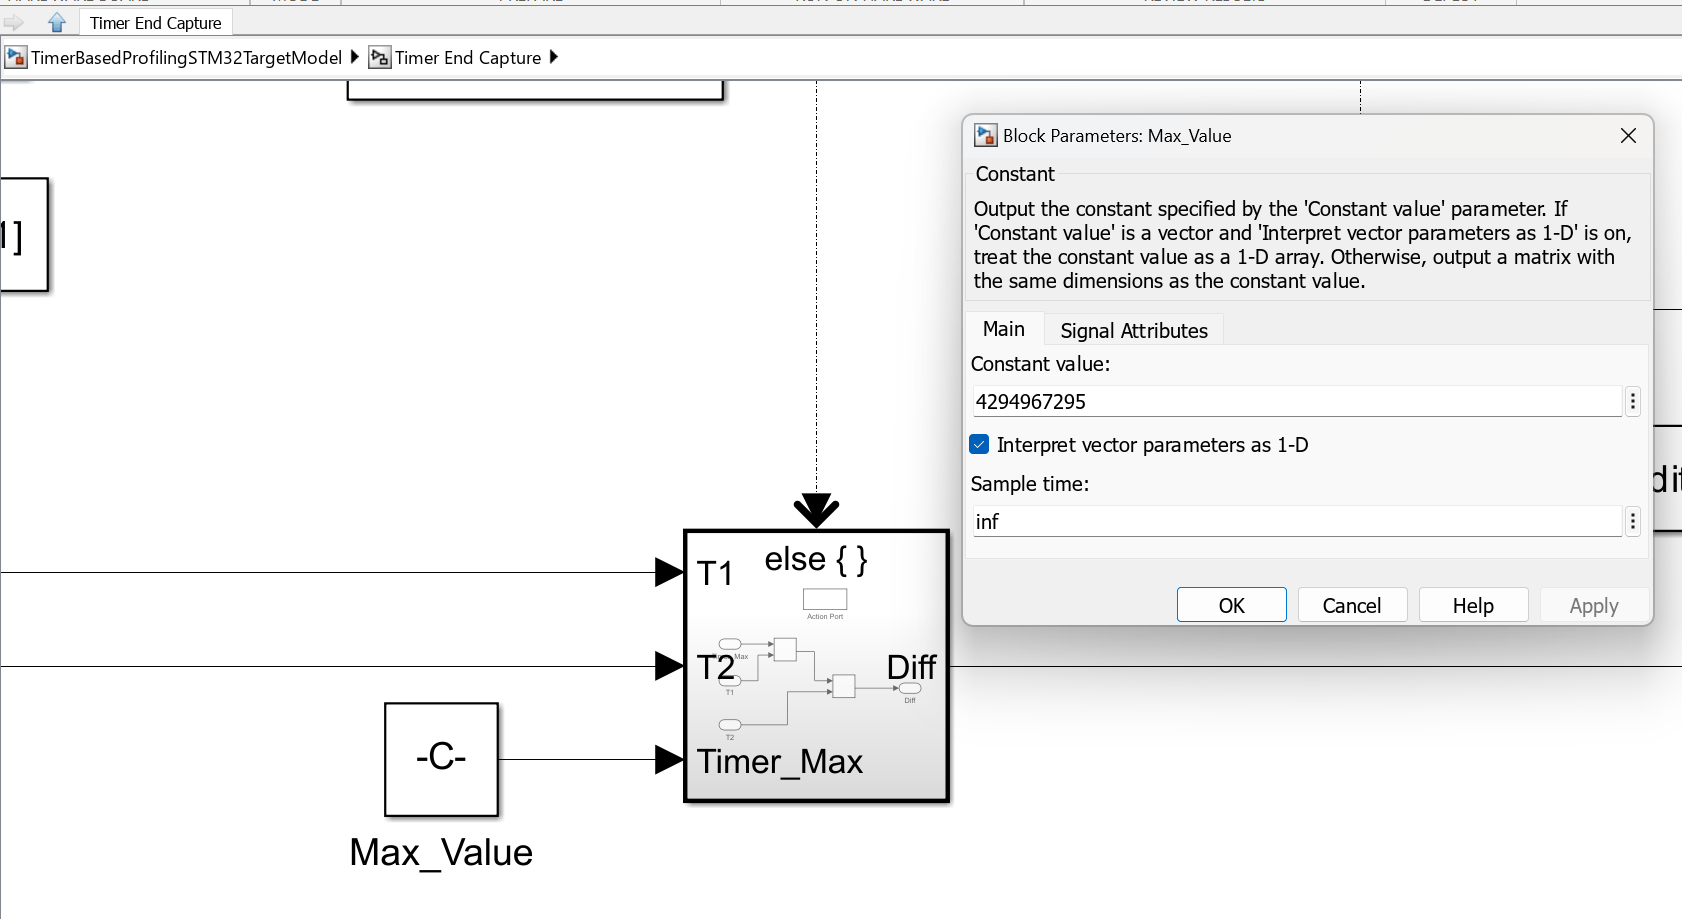
If a timer other than a 32-bit timer is used, ensure to update the maximum value that the timer can count to in the Max_Value constant block within the Timer End Capture subsystem.
The serial module used for communication must be selected in the UART/USART Write block located at the following path: TimerBasedProfilingSTM32TargetModel > Send over Serial > Serial Transmit > While Iterator Subsystem > UART/USART Write.

Model Configurations
In the target model configure:
Similar to GPIO Based Profiling, configure the sample time parameter of the Function-Call Generator to the sample time at which the algorithm was originally triggered.
In the host model, configure the Serial Configuration and Serial Receive block as follows:
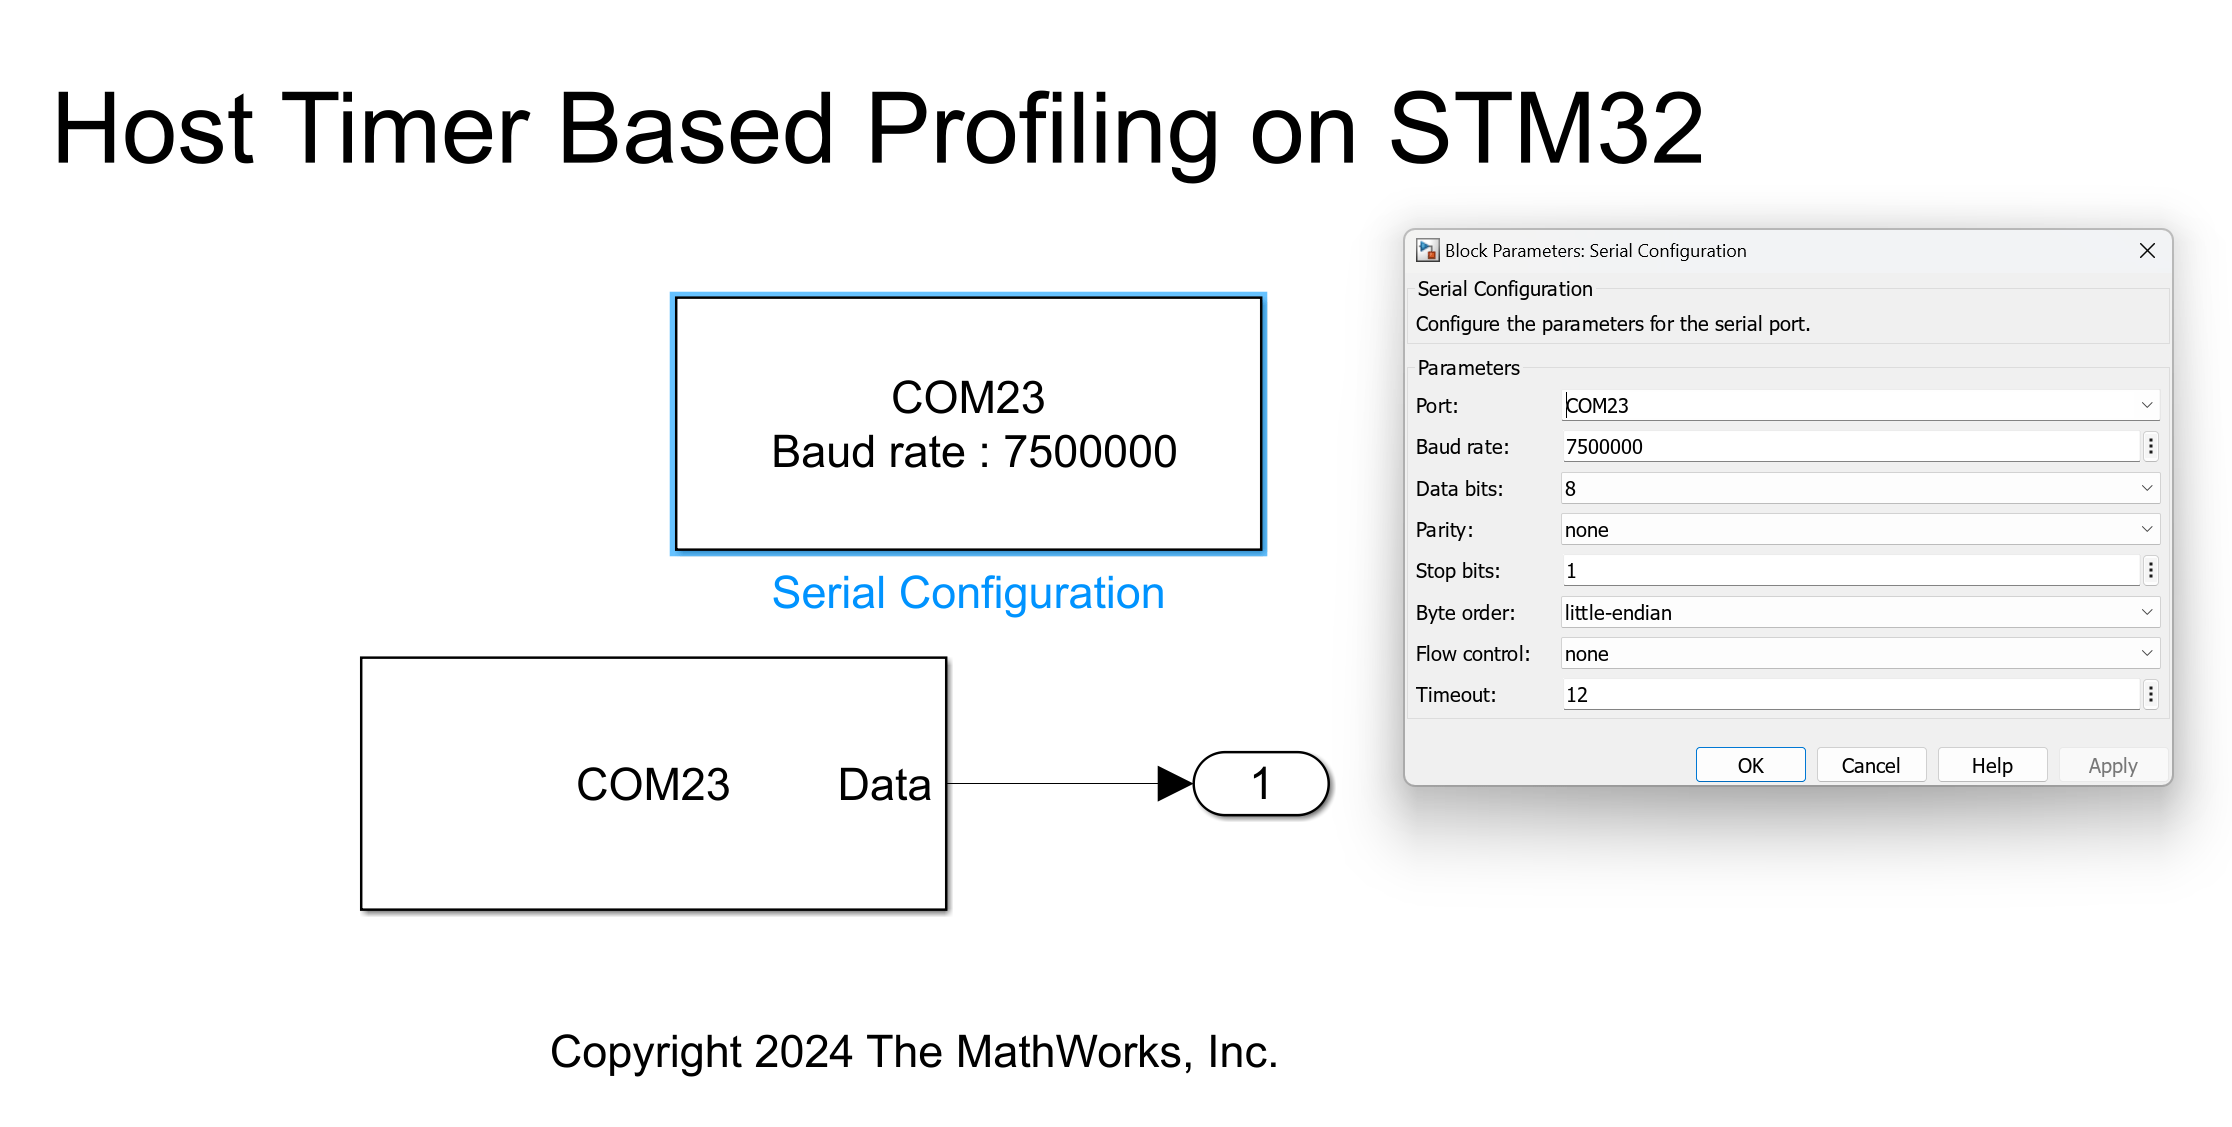
Set the COM port to match the COM port of the connected Nucleo board.
Ensure the baud rate matches the baud rate specified in the
.iocfile.Customize the Custom value output by the block as needed to handle issues with serial communication.
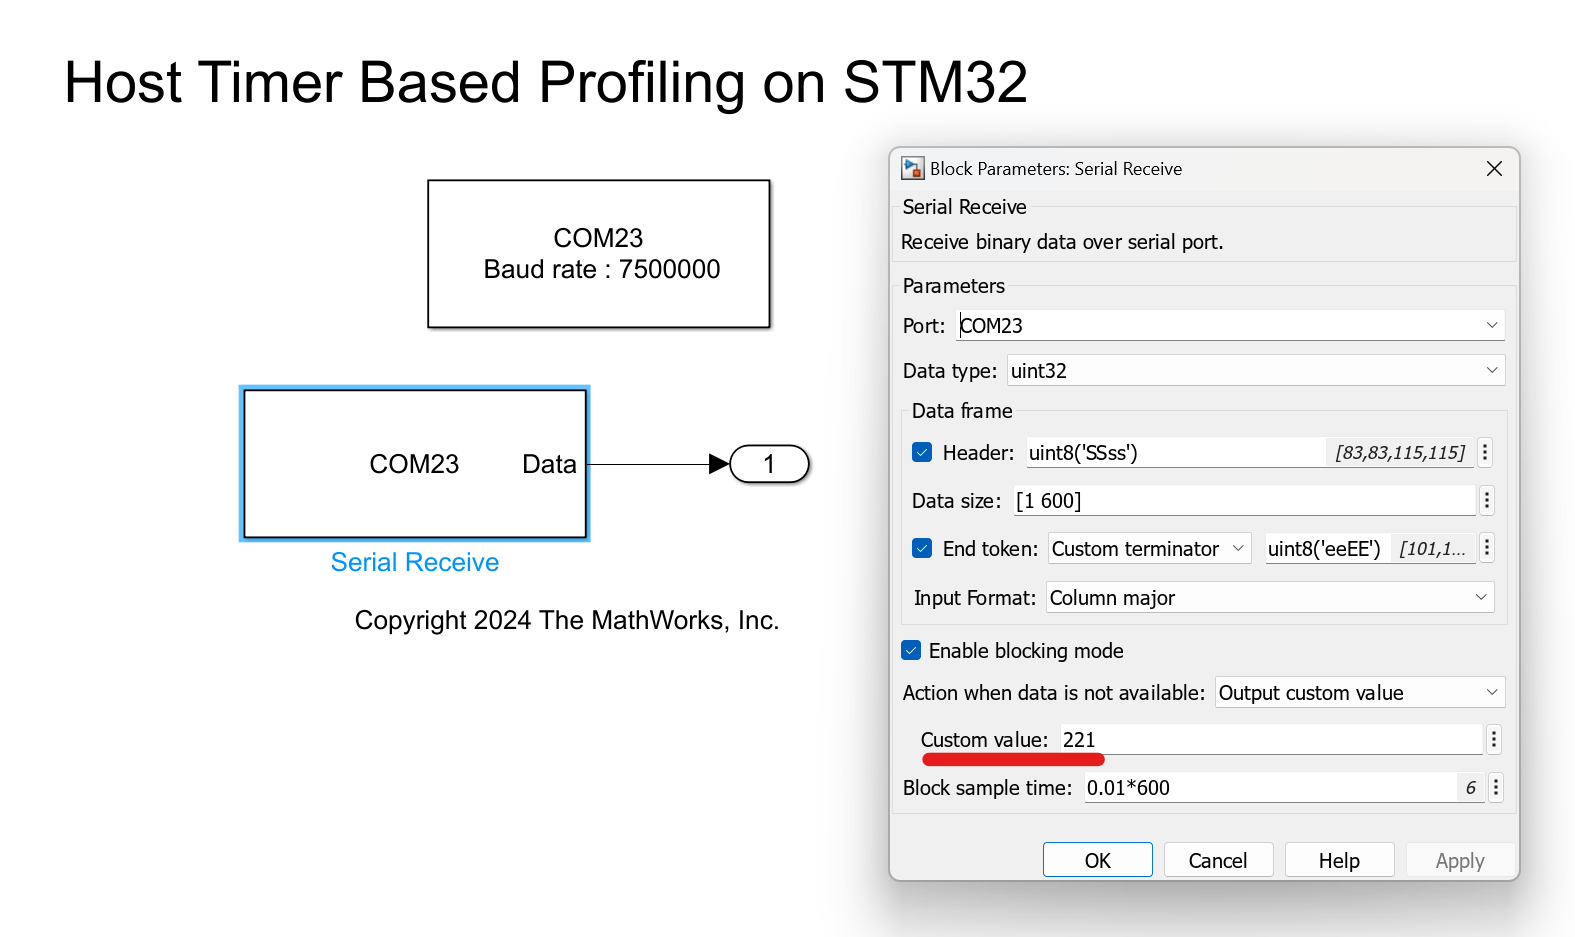
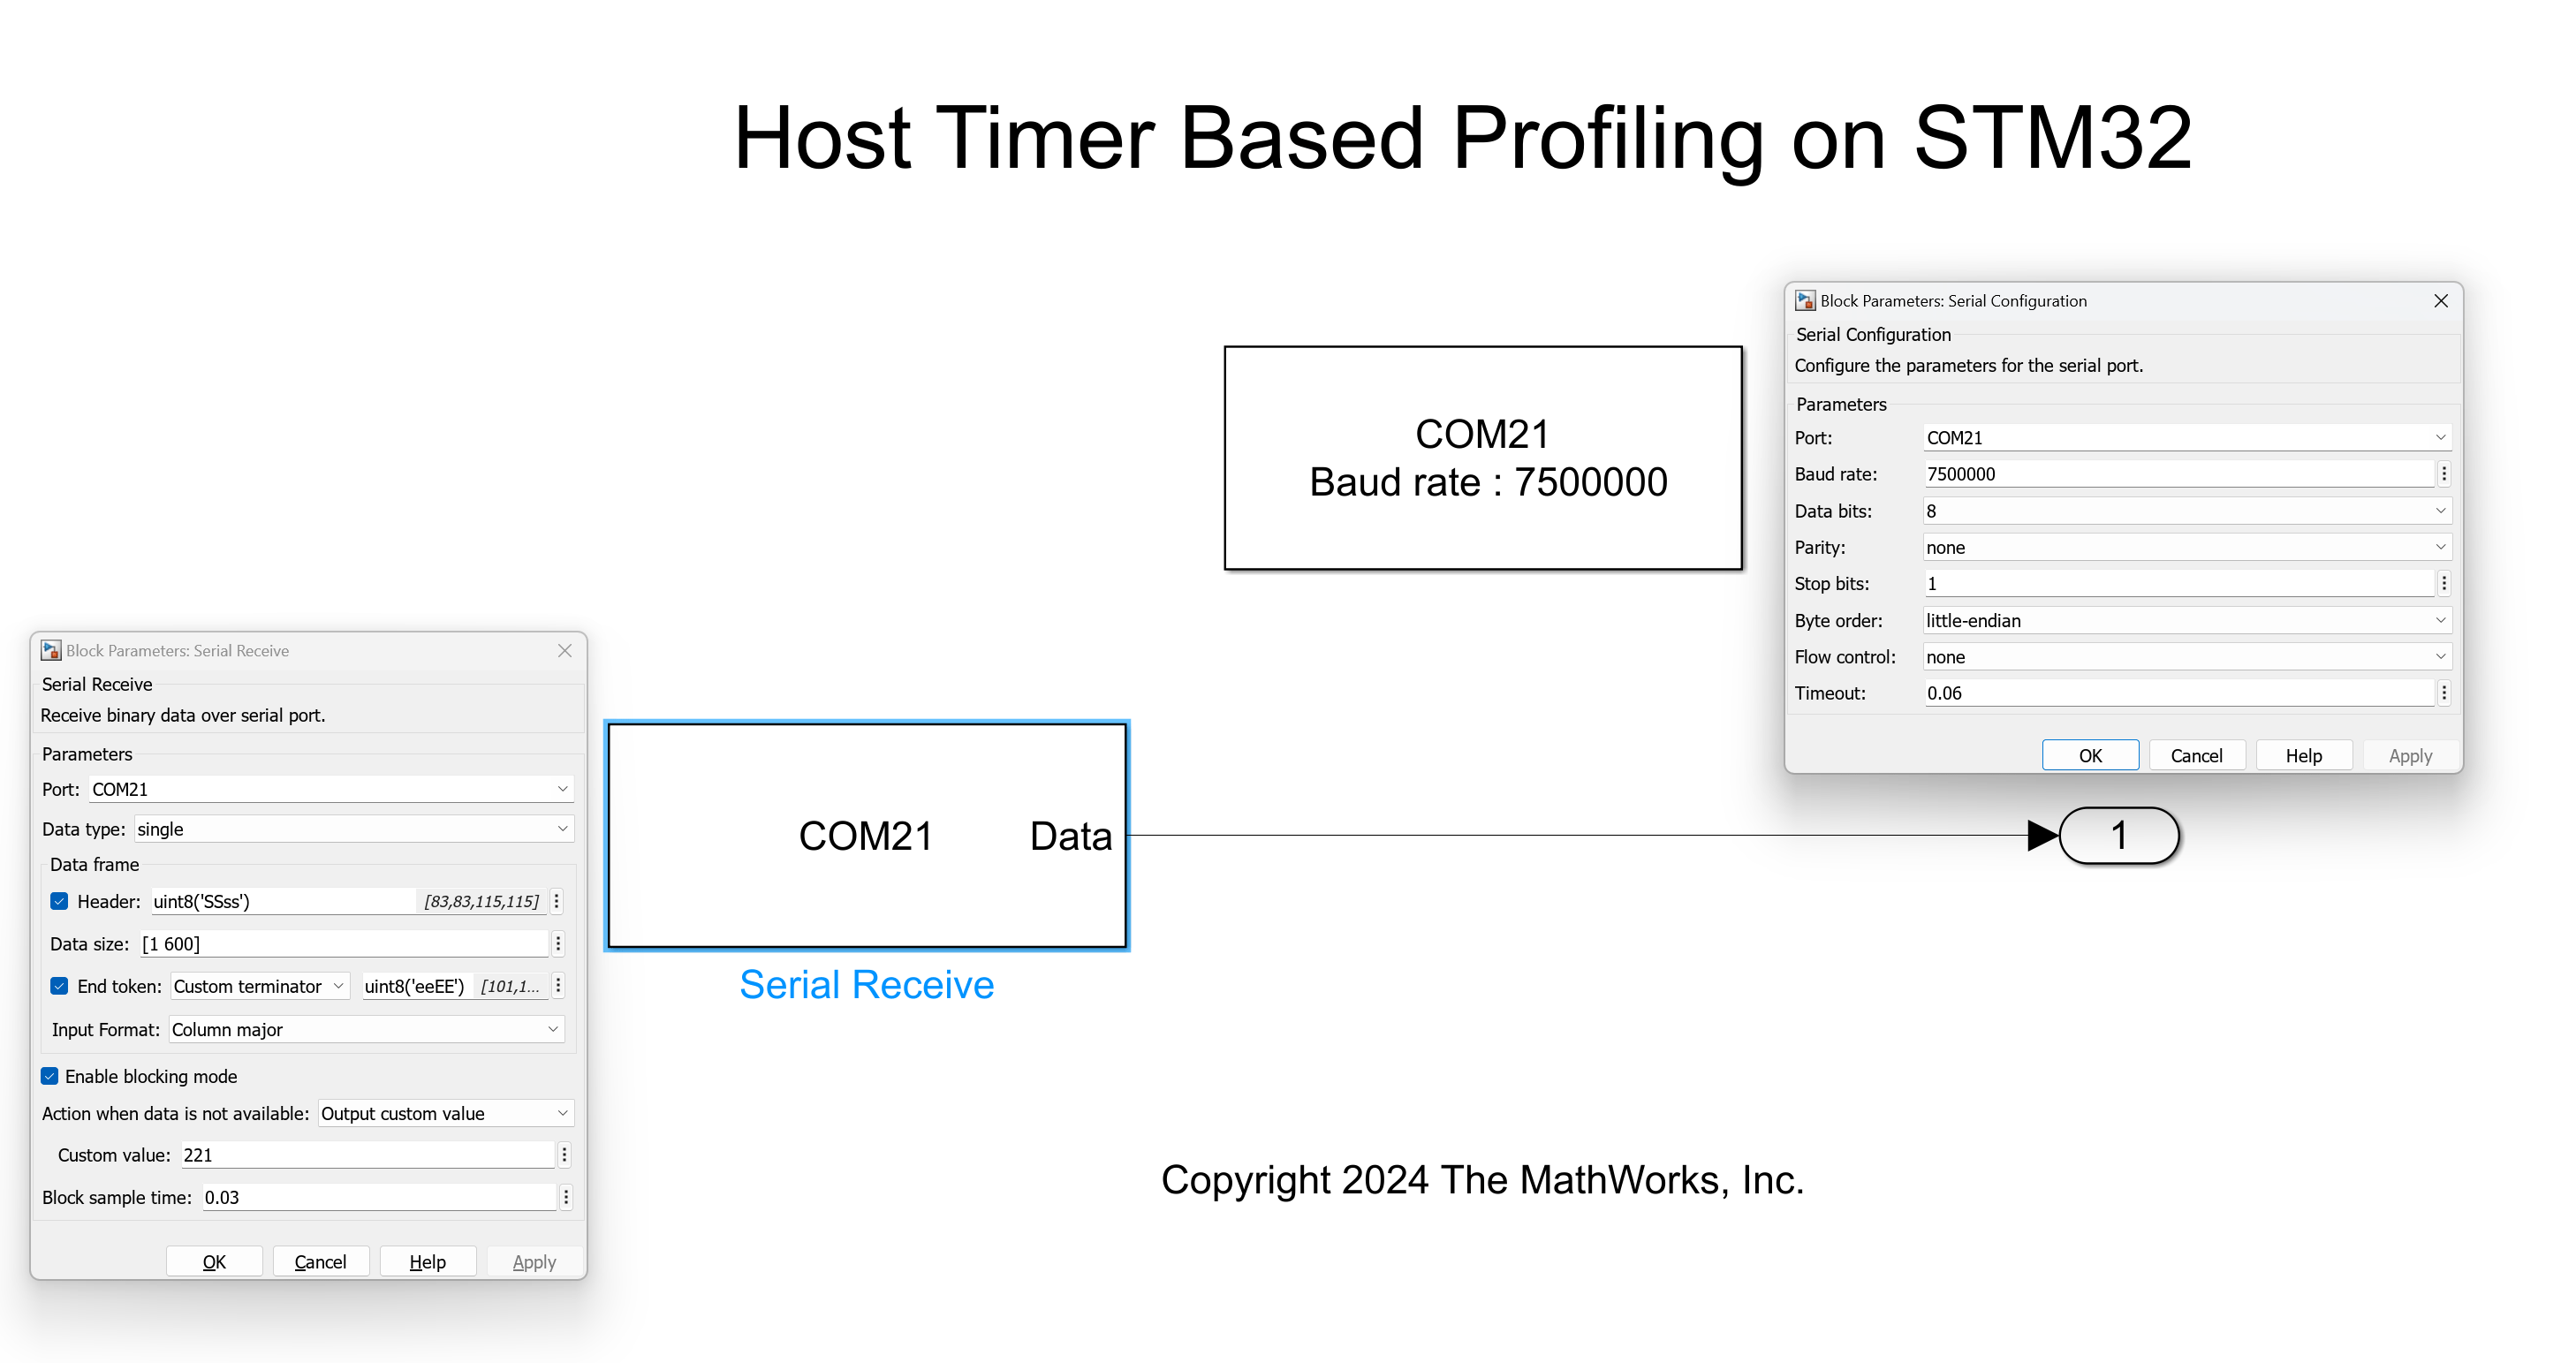
Ensure that the sample time is set to the frame size of the transmitted data multiplied by the sample time of the block being profiled in the target model. For example, with a default frame size of 600 and a block sample time of 0.01s for the function-call generator, the block sample time is 6s.
Adjust the timeout setting in the Serial Configuration block to be greater than twice the block sample time of the Serial Receive block. In this scenario, it should be set to at least 12s.
Click on Build, Deploy and Start in the target model.
Once the target model is deployed, you can proceed to run the host model.
Stop the simulation when necessary.
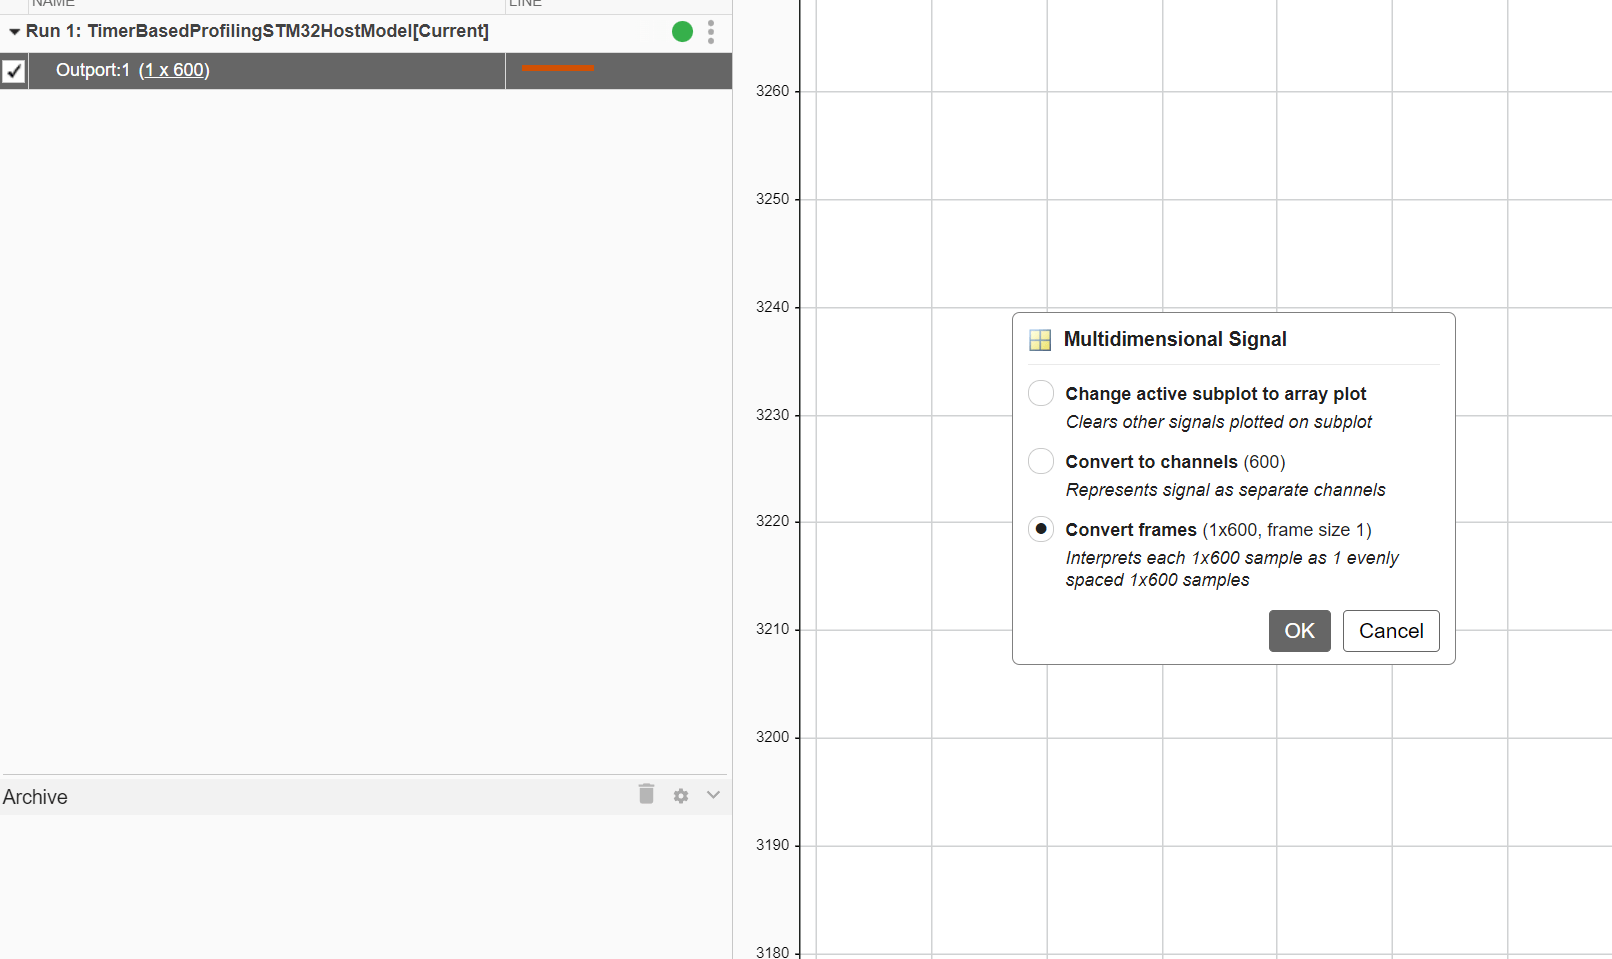
In Simulink Data Inspector, select the Outport, choose Convert frames, and then click OK.
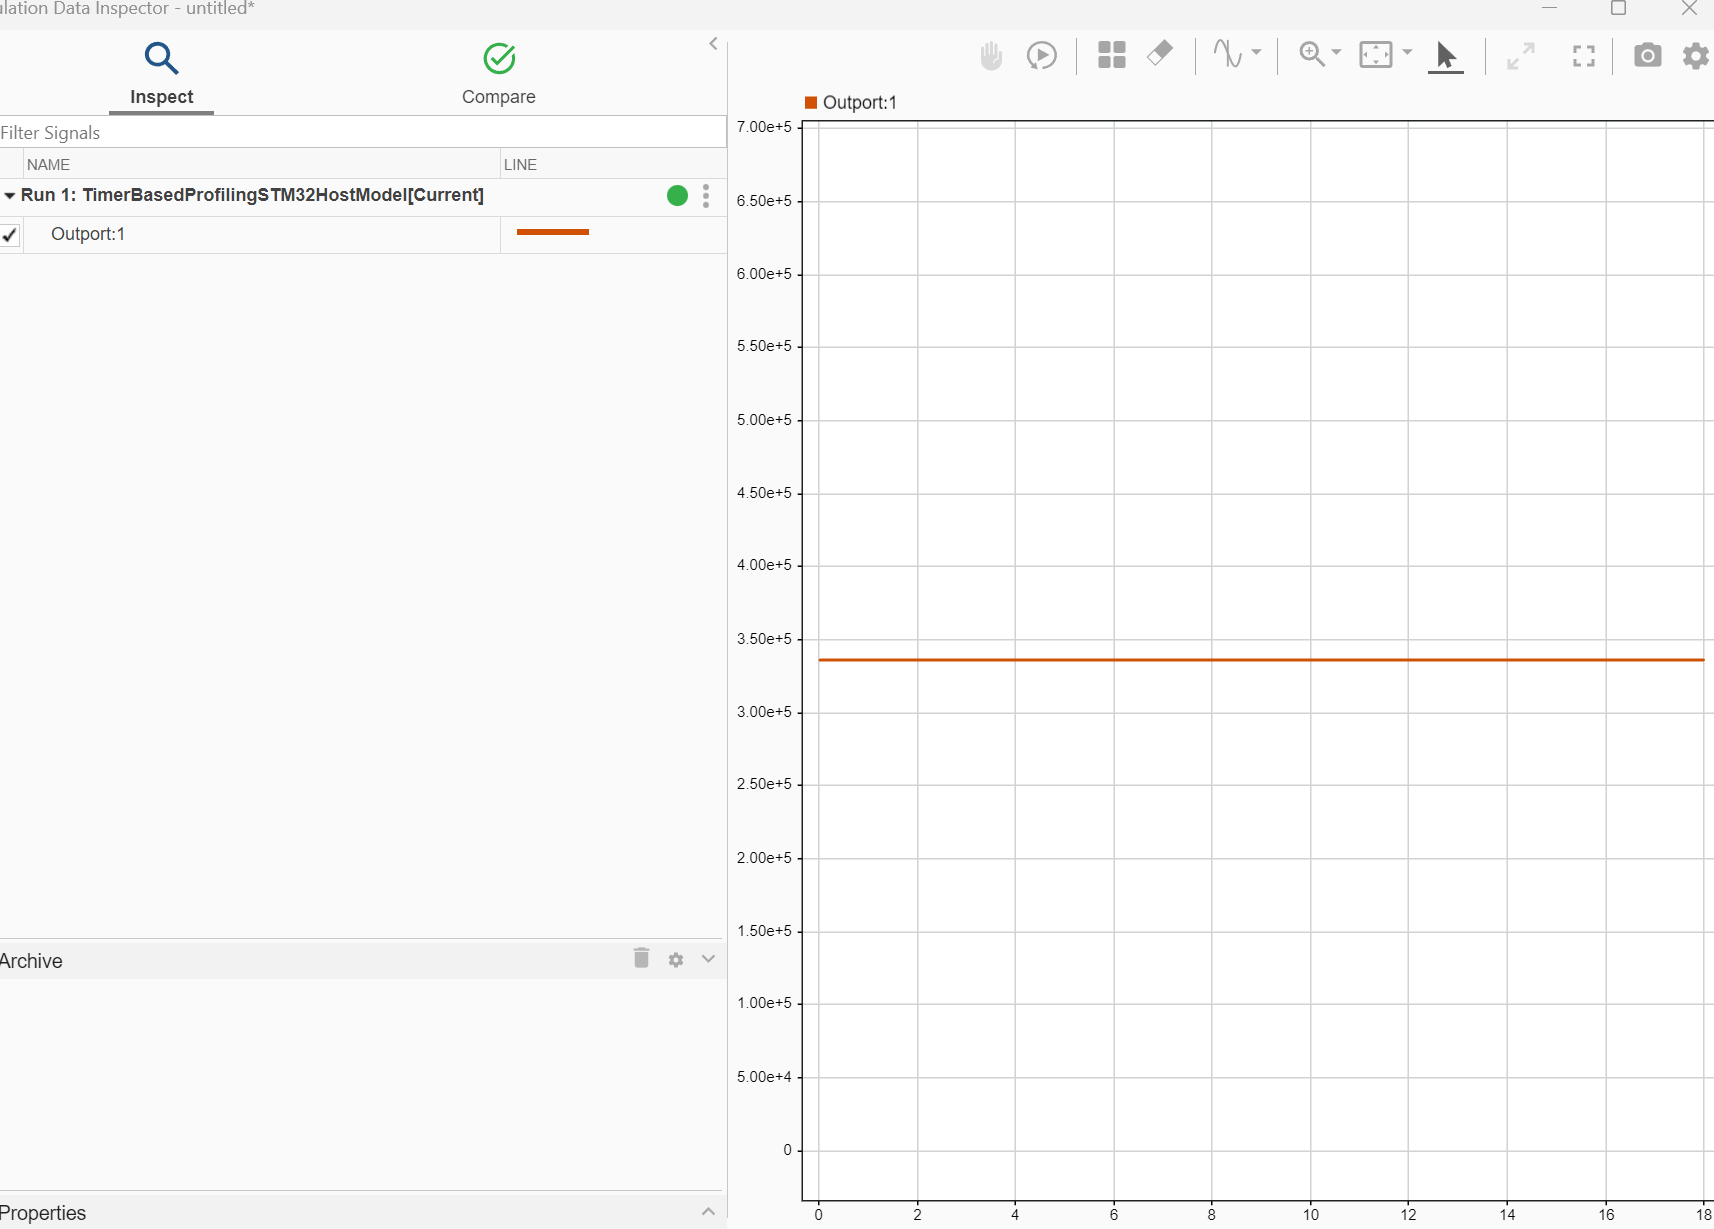
To convert the plotted timer counts into time, divide the count value by the frequency of the timer clock.
TimerCounts = 3.361e5;                      % Counts as displayed in SDI
TimerClock = 170e6;                         % Hz, Timer clock, visible inSTM32CubemX
ExecutionTime = TimerCounts/TimerClock      % s, Time taken for code execution
ExecutionTime =
0.0020
Note: A 2-millisecond delay is introduced with the block being profiled, so the Execution Time is 0.0020 in the final output.
Profiling Motor Control Algorithms
In this task you will learn how to profile a motor control algorithm using either a General Purpose Input/Output (GPIO)-based or Timer-based approach. The example modifies the Sensorless Field-Oriented Control of PMSM Using STM32 Processor Based Board tutorial using STM32 Processor-Based Boards for profiling purposes. For detailed configuration steps for motor control, see Sensorless Field-Oriented Control of PMSM Using STM32 Processor Based Boards.
Required Hardware
Available Models
The example includes following models:
Peripheral Configurations
Use the peripheral configurations set for GPIO and Timer for motor control profiling.
Model Configurations
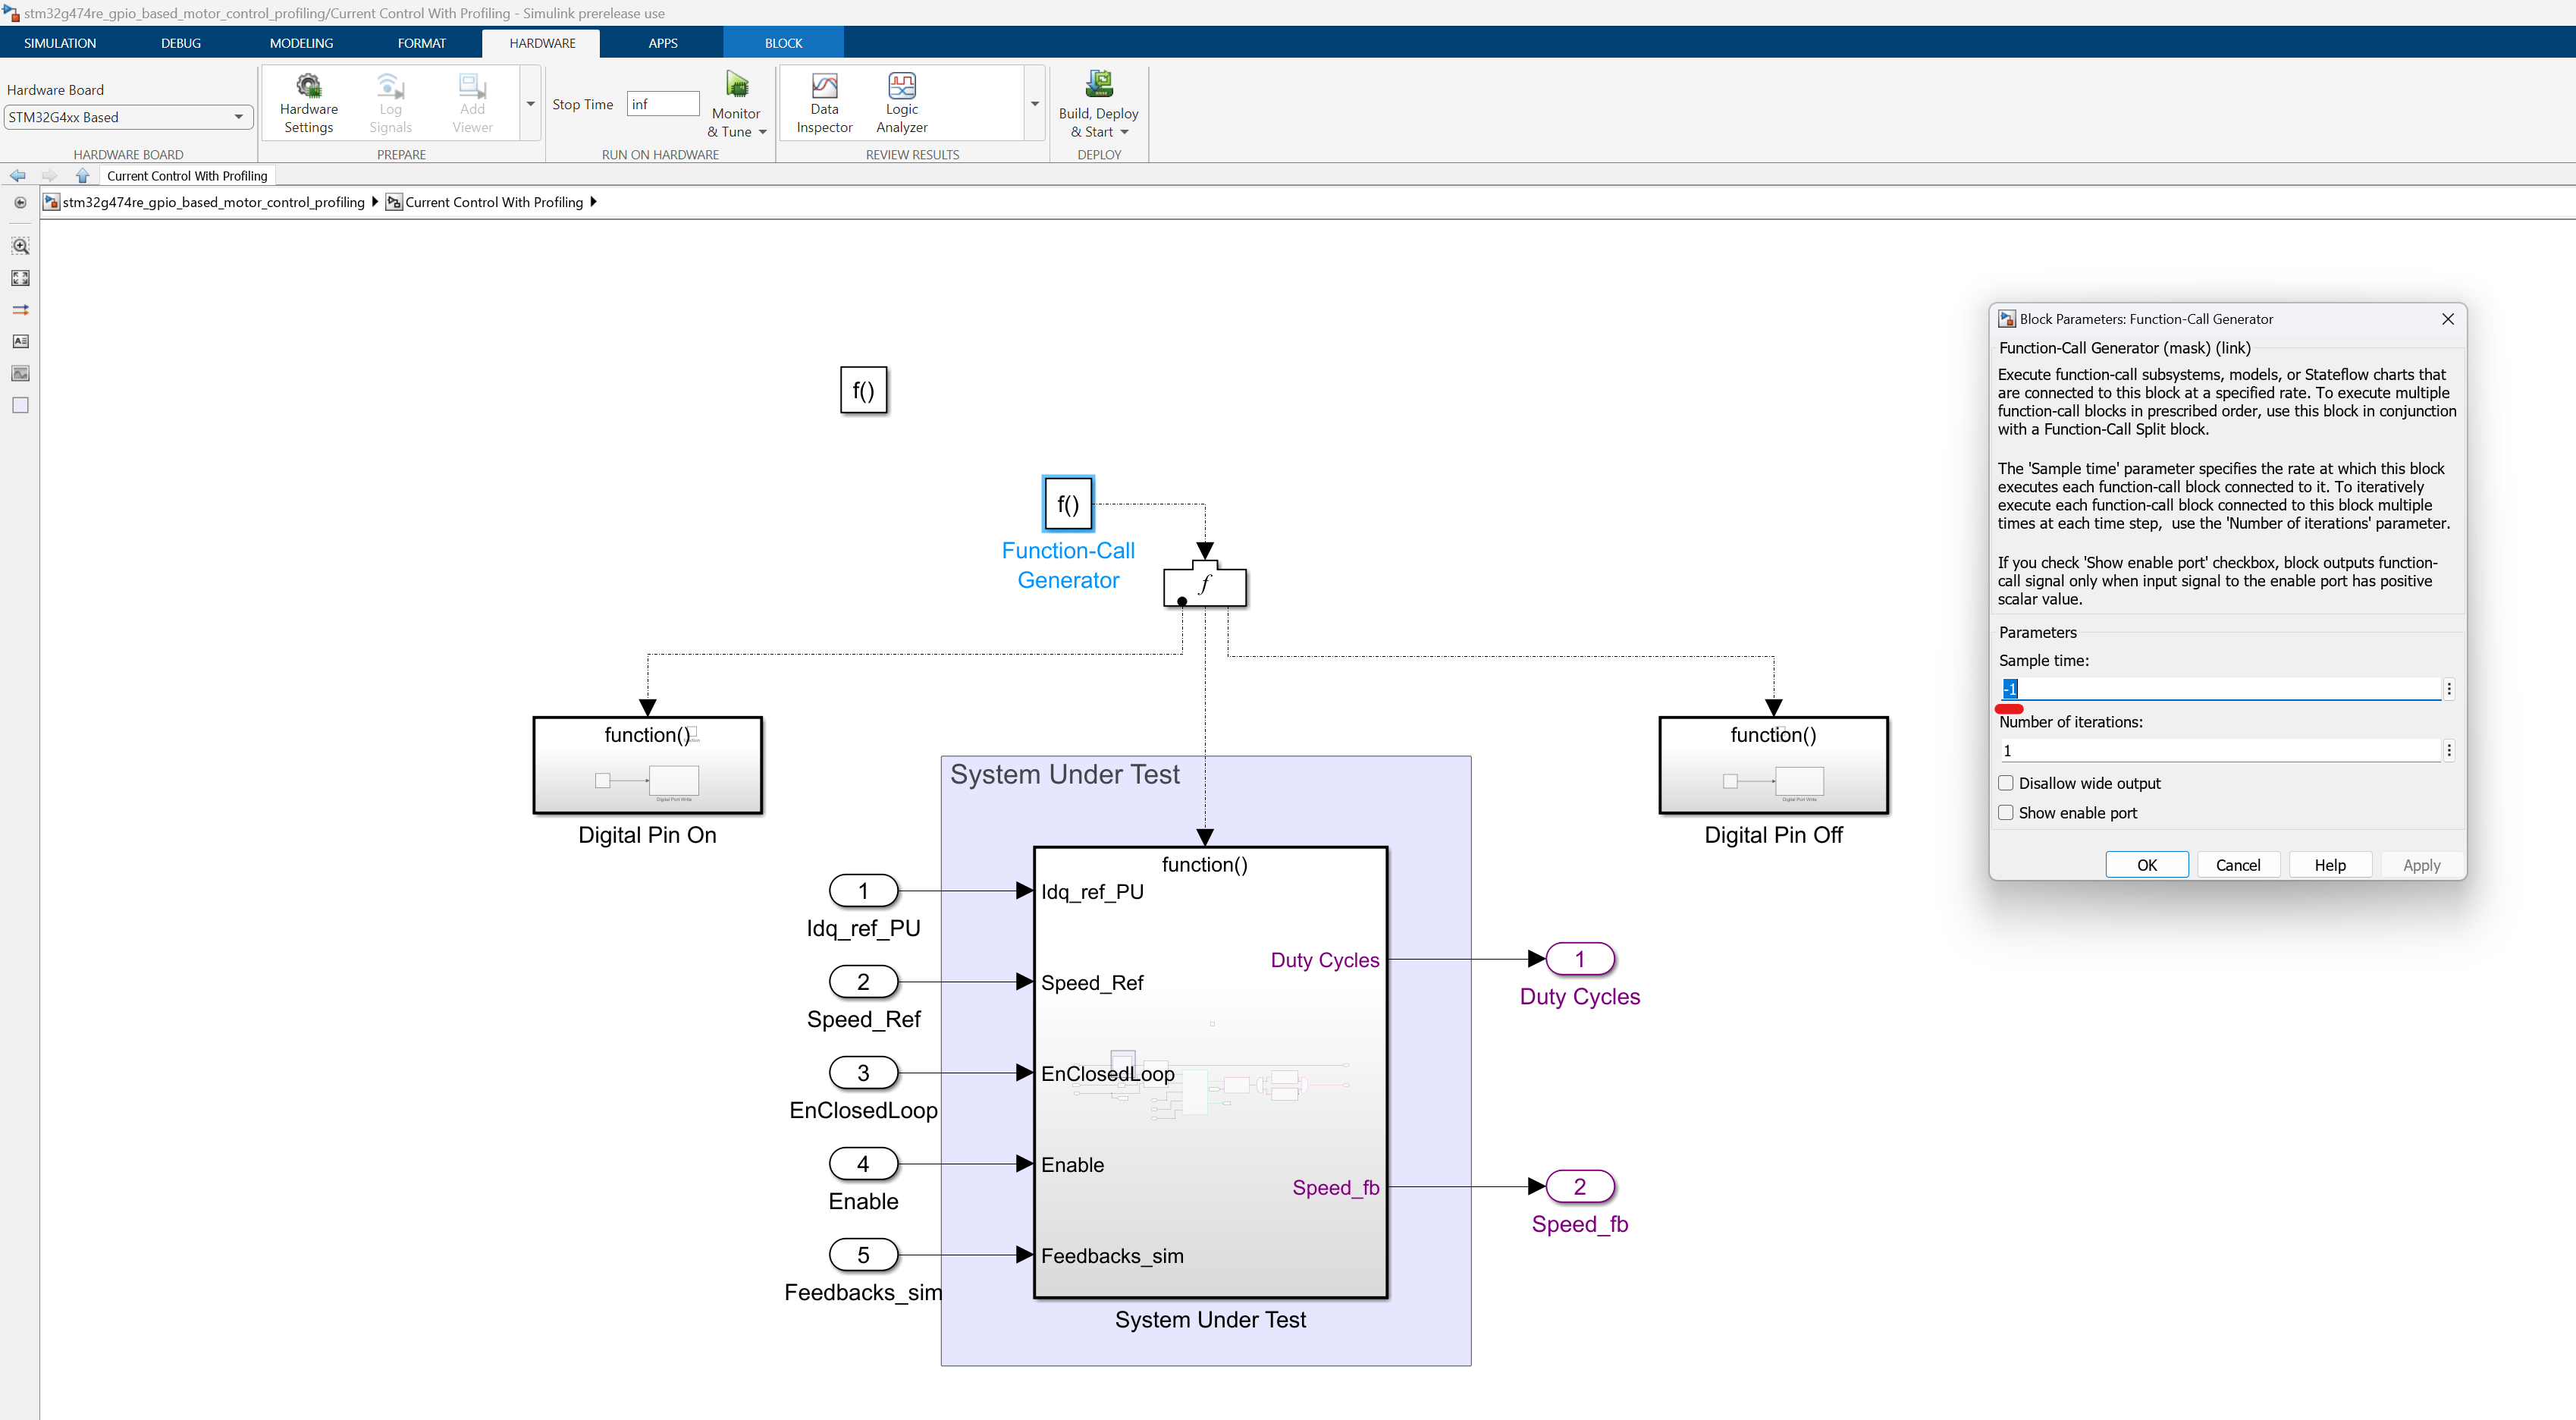
In the previous task, we profiled synchronous code with the sample time set within Simulink. For motor control, however, the control algorithm's interrupts are asynchronous. To profile an asynchronous function call subsystem, follow these steps:
Place the contents of either target model or an individual block into the function call subsystem to be profiled.
Paste the algorithm to be profiled into the System Under Test subsystem.
Change the sample time of the function call subsystem to
-1.
The final configuration should resemble:
To obtain the code execution time, follow the same steps as mentioned in the previous tasks, based on the chosen profiling method. For timer-based profiling, configure the host serial settings using the expected execution rate of the algorithm to calculate sample time and timeout values. For example, in motor control, the current control algorithm is expected to run every 50 microseconds (50µs). Therefore, set the serial configuration as follows:
Profiling Individual Blocks
To profile individual blocks, right click on the block to be profiled and in the Subsystem & Model Reference option, select Create Subsystem from Selection.
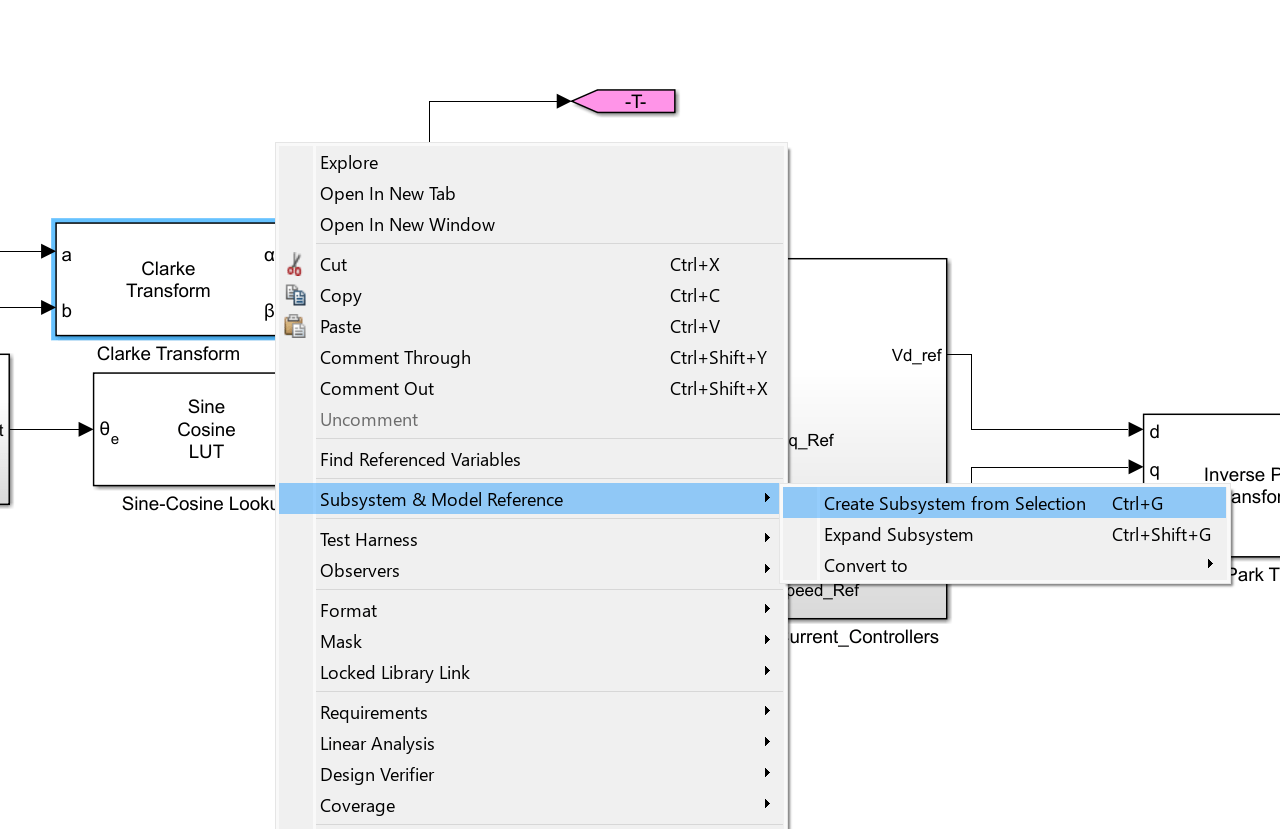
Since the block is now in a function-call subsystem, you can follow the entire profiling function-call subsystem workflow.