coder.profile.test.runTests
Automate execution-time or stack usage analysis of code generated from Simulink models or MATLAB functions
Since R2024a
Syntax
Description
resultsSet = coder.profile.test.runTests(testComponent)testComponent, by using inputs provided by the
model. The function runs in two stages. First, the function runs the tests with only task
profiling enabled. Then, the function runs the most demanding tests again with detailed
function profiling enabled.
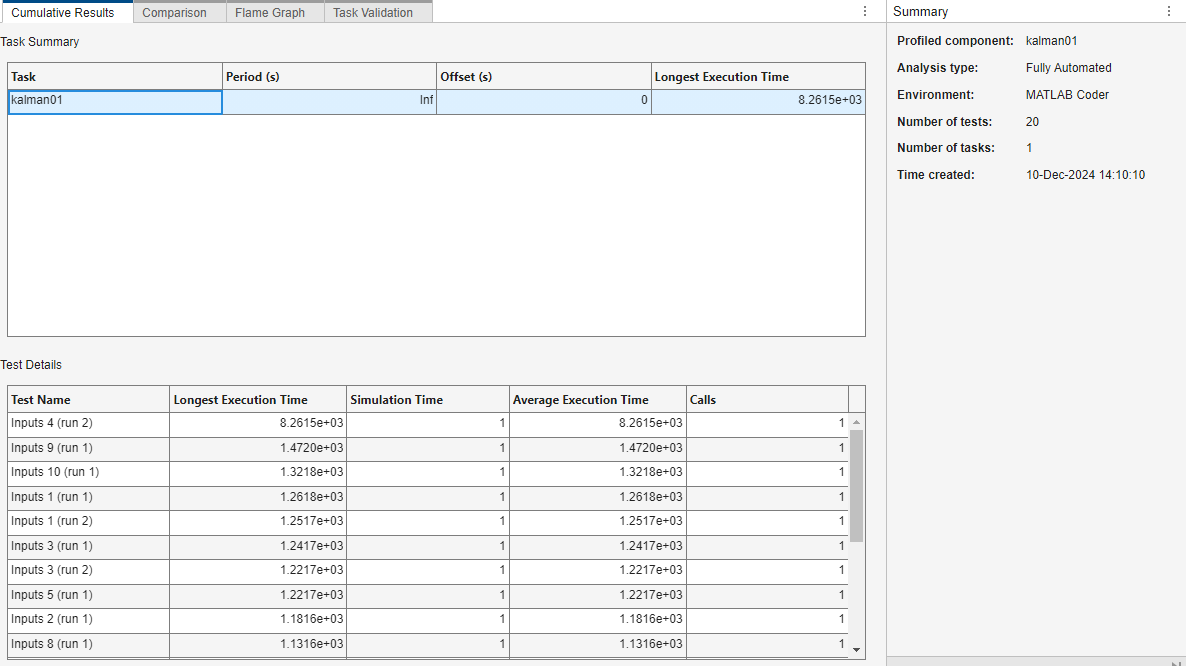
In the first stage, runTests captures the execution times of tasks
for the given inputs. In the second stage, runTests identifies how code
is executed. For example, it generates a visualization of the function-call stack.
runTests does not run detailed profiling in the first stage because
instrumentation overhead can be significant and invalidate the acquired time
measurements.
The function stores execution-time results in the resultsSet object.
Use the Code Profile
Analyzer app to analyze the results.
For information about importing test cases into a model, see Overview of Signal Loading Techniques and Load Input Data for Basic Test Cases.
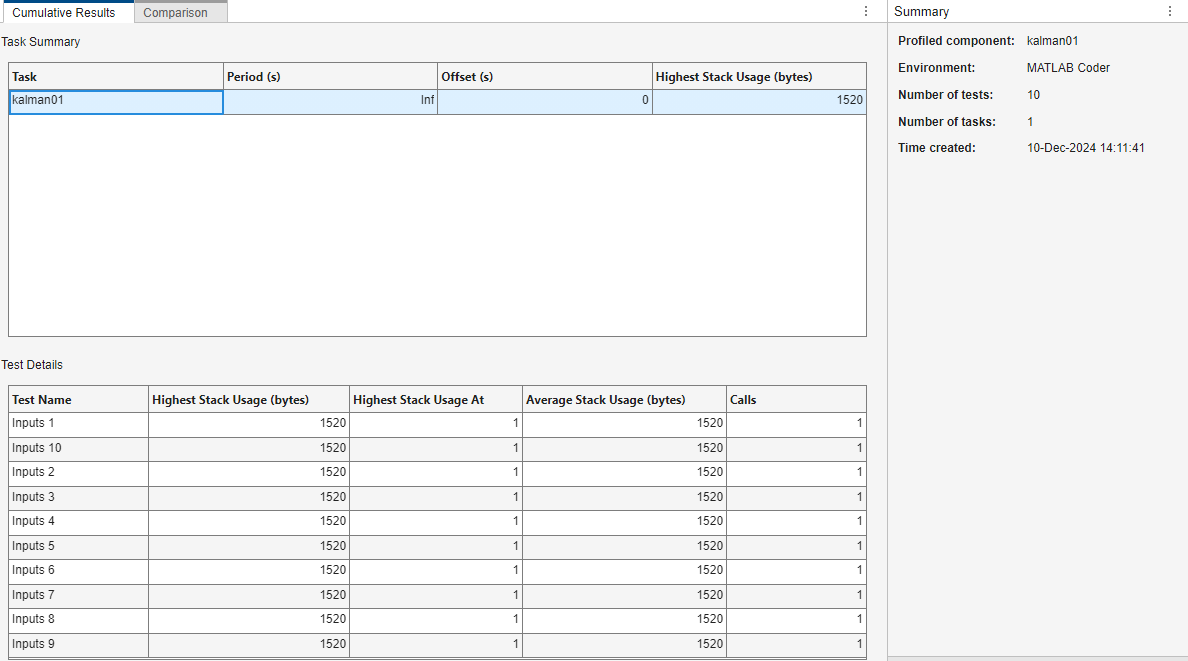
resultsSet = coder.profile.test.runTests(testComponent,CodeMetric="stack")resultsSet
object. For stack usage analysis, there is only one stage because instrumentation does not
affect the results. Use the Code Profile Analyzer app to
analyze the results.
resultsSet = coder.profile.test.runTests(testComponent,TestFile="myTestFile")myTestFile. As explained previously, the
function runs in two stages to reduce the impact of instrumentation overhead.
If the test cases cover system requirements and exercise as many as possible code paths, you can use the function and the Code Profile Analyzer app to identify and analyze performance hotspots in the generated code.
resultsSet = coder.profile.test.runTests(testComponent,MATLABConfig=objConfig,MATLABInputs=inputSource)testComponentinputSource
objConfig is a MATLAB configuration object for code generation.
[
runs two SIL or PIL tests using resultsSet secondResultsSet] = coder.profile.test.runTests(___,OverrideSettings=keyValueMapping)keyValueMapping, a
Map object that maps model configuration parameters to pairs of values.
For the first test, the function uses the first value of each pair. For the second test, the
function uses the second value of each pair. The function returns two sets of results,
resultsSet and secondResultsSet.
resultsSet = coder.profile.test.runTests(___,Name=Value)


