plotPosition
Display current position in geoplayer figure
Description
plotPosition(
uses player,lat,lon,Name,Value)Name,Value pair arguments to modify aspects of the plotted
points.
For example, plotPosition(player,45,0,'Color','w','Marker','*')
plots a point in the geoplayer figure as a white star.
Examples
Load a sequence of latitude and longitude coordinates.
data = load('geoRoute.mat');Create a geographic player and set the zoom level to 12. Compared to the default zoom level, this zoom level zooms the map out by a factor of 8.
player = geoplayer(data.latitude(1),data.longitude(1),12);
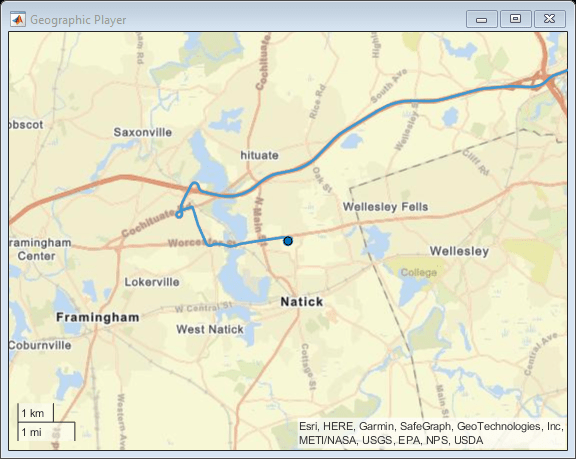
Display the full route.
plotRoute(player,data.latitude,data.longitude);
Display the coordinates in a sequence. The circle marker indicates the current position.
for i = 1:length(data.latitude)
    plotPosition(player,data.latitude(i),data.longitude(i));
    pause(0.05)
end
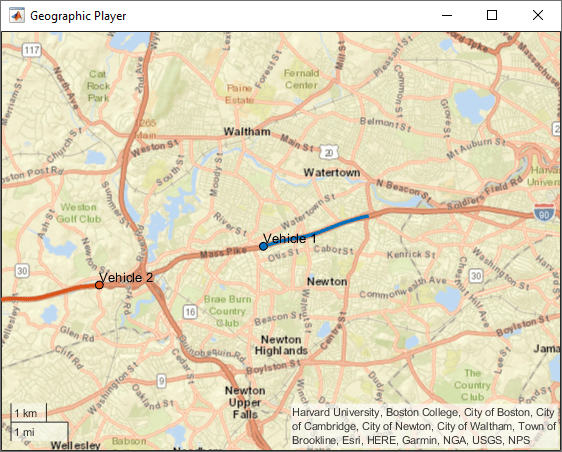
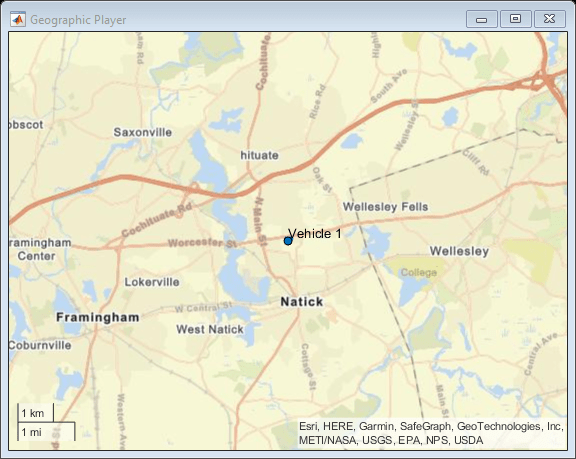
Plot multiple routes simultaneously in a geographic player. First, assign each route a unique identifier. Then, when plotting points on the routes using the plotPosition object function, specify the route identifier using the 'TrackID' name-value pair argument. In this example, the routes are labeled Vehicle 1 and Vehicle 2. This screen capture shows the point where the two routes are about to cross paths.
Load data for a route.
data = load('geoRoute.mat');Extract data for the first vehicle.
lat1 = data.latitude;
lon1 = data.longitude;
Create a synthetic route for the second vehicle that drives the same route in the opposite direction.
lat2 = flipud(lat1);
lon2 = flipud(lon1);
Create a geoplayer object. Initialize the player to display the last 10 positions as a line trailing the current position.
zoomLevel = 12;
player = geoplayer(lat1(1),lon1(1),zoomLevel,...
    'HistoryDepth',10,'HistoryStyle','line');
Plot the positions of both vehicles as they move over the route. Specify an ID for each track by using the 'TrackID' name-value pair argument. By default, the geoplayer object centers the display of the vehicle on the first track. You can center the display on other tracks by using the CenterOnID property of the geoplayer object.
loopCounter = length(lat1);
for i = 1:loopCounter
     plotPosition(player,lat1(i),lon1(i),'TrackID',1,'Label','Vehicle 1');
     plotPosition(player,lat2(i),lon2(i),'TrackID',2,'Label','Vehicle 2');
end
Input Arguments
Name-Value Arguments
Specify optional pairs of arguments as
Name1=Value1,...,NameN=ValueN, where Name is
the argument name and Value is the corresponding value.
Name-value arguments must appear after other arguments, but the order of the
pairs does not matter.
Before R2021a, use commas to separate each name and value, and enclose
Name in quotes.
Example: 'Color','k'
Text description of the point, specified as the comma-separated pair
consisting of 'Label' and a character vector or
string scalar.
Example: 'Label','07:45:00AM'
Marker color, specified as the comma-separated pair consisting of
'Color' and a color name, short color name, or
RGB triplet. By default, the marker color is selected
automatically.
For a
custom color, specify an RGB triplet. An RGB triplet is a three-element row vector whose
elements specify the intensities of the red, green, and blue components of the color. The
intensities must be in the range [0,1]; for example, [0.4 0.6
0.7]. Alternatively, you can specify some common colors by name. This table lists
the named color options and the equivalent RGB triplet values.
| Color Name | Color Short Name | RGB Triplet | Appearance |
|---|---|---|---|
'red' | 'r' | [1 0 0] |
|
'green' | 'g' | [0 1 0] |
|
'blue' | 'b' | [0 0 1] |
|
'cyan'
| 'c'
| [0 1 1] |
|
'magenta' | 'm' | [1 0 1] |
|
'yellow' | 'y' | [1 1 0] |
|
'black' | 'k' | [0 0 0] |
|
'white' | 'w' | [1 1 1] |
|
Example: 'Color',[1 0 1]
Example: 'Color','m'
Example: 'Color','magenta'
Marker symbol, specified as the comma-separated pair consisting of
'Marker' and one of the markers in this
table.
| Marker | Description | Resulting Marker |
|---|---|---|
"o" | Circle |
|
"+" | Plus sign |
|
"*" | Asterisk |
|
"." | Point |
|
"x" | Cross |
|
"_" | Horizontal line |
|
"|" | Vertical line |
|
"square" | Square |
|
"diamond" | Diamond |
|
"^" | Upward-pointing triangle |
|
"v" | Downward-pointing triangle |
|
">" | Right-pointing triangle |
|
"<" | Left-pointing triangle |
|
"pentagram" | Pentagram |
|
"hexagram" | Hexagram |
|
Approximate diameter of marker in points, specified as the
comma-separated pair consisting of 'MarkerSize' and
a positive real scalar. 1 point = 1/72 inch. A marker size larger than 6
can reduce the rendering performance.
Unique identifier for plotted track, specified as a positive integer. Use this value to identify individual tracks when you plot multiple tracks. When you specify this value, all other name-value pair arguments for this function apply to only the track specified by this unique identifier.
Tips
When a vehicle's track goes outside of viewable area, the map automatically re-centers based on the value of the
geoplayerCenterOnIDproperty.
Version History
Introduced in R2018a
See Also
geoplayer | plotRoute | reset | latlon2local | local2latlon
1 Alignment of boundaries and region labels are a presentation of the feature provided by the data vendors and do not imply endorsement by MathWorks®.