Main Content

show

Show site in Site Viewer

Description

show(site) displays the location of the specified transmitter or receiver site in the current Site Viewer using a marker.

example

show(site,Name=Value) specifies options using one or more name-value arguments.

Examples

collapse all

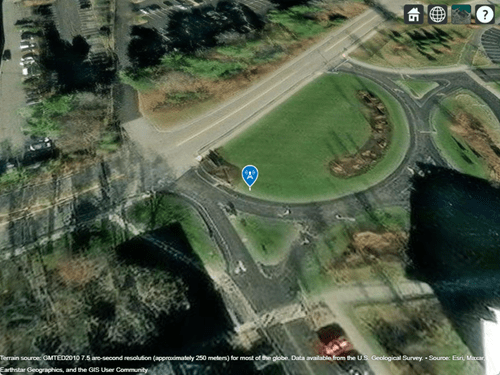
Create a receiver site. By default, receiver sites use geographic coordinates. Specify the latitude as 42.3001 degrees and the longitude as -71.3504 degrees.

rx = rxsite(Name="MathWorks Apple Hill", ...
    Latitude=42.3001,Longitude=-71.3504);

Display the receiver site.

show(rx)

Receiver site displayed over satellite imagery

Create and show a transmitter site.

tx = txsite('Name','MathWorks Apple Hill',...
       'Latitude',42.3001, ...
       'Longitude',-71.3504);
show(tx)

Hide the transmitter site.

hide(tx)

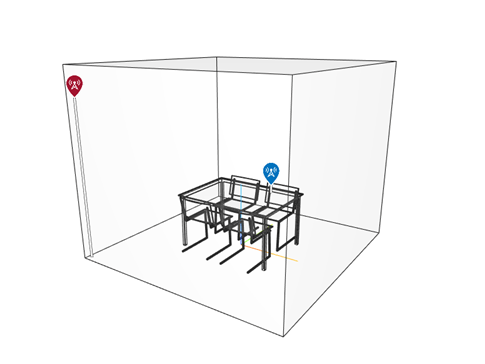
Import and view an STL file. The file models a small conference room with one table and four chairs.

viewer = siteviewer('SceneModel','conferenceroom.stl');

Create a transmitter site near the upper corner of the room and a receiver site above the table. Specify the position using Cartesian coordinates in meters. Then, visualize the sites.

tx = txsite('cartesian', ...
    'AntennaPosition',[-1.46; -1.42; 2.1]);
rx = rxsite('cartesian', ...
    'AntennaPosition',[0.3; 0.3; 0.85]);

show(tx)
show(rx)

Pan by left-clicking, zoom by right-clicking or by using the scroll wheel, and rotate the visualization by clicking the middle button and dragging or by pressing Ctrl and left-clicking and dragging.

Hide the sites.

hide(tx)
hide(rx)

Input Arguments

collapse all

Transmitter or receiver site, specified as an array of txsite objects or an array of rxsite objects. You can also specify a scalar txsite or rxsite object.

Name-Value Arguments

collapse all

Specify optional pairs of arguments as Name1=Value1,...,NameN=ValueN, where Name is the argument name and Value is the corresponding value. Name-value arguments must appear after other arguments, but the order of the pairs does not matter.

Example: show(site,ClusterMarkers=true) combines nearby markers into groups.

Before R2021a, use commas to separate each name and value, and enclose Name in quotes.

Example: show(site,"ClusterMarkers",true) combines nearby markers into groups.

Name of the image file, specified as a string scalar or character vector.

Data Types: char | string

Width and height of the icon, specified as a 1-by-2 vector of positive numeric values in pixels.

Vertical position of icon relative to the site, specified as on of this options:

  • "bottom" — Align the icon below the antenna position of the site.

  • "center" — Align the center of the icon with the antenna position of the site.

  • "top" — Align the icon above the antenna position of the site.

Option to combine nearby markers into groups or clusters, specified as numeric or logical 1 (true) or 0 (false).

Data Types: logical

Map for visualization of surface data, specified as a siteviewer object.1

Data Types: char | string

Option to show a white line from the site down to the nearest surface, specified as numeric or logical 1 (true) or 0 (false).

Data Types: logical

Version History

Introduced in R2019b

See Also

Functions


1 Alignment of boundaries and region labels are a presentation of the feature provided by the data vendors and do not imply endorsement by MathWorks®.