visualize
Open 'EBU Mode' meter display
Description
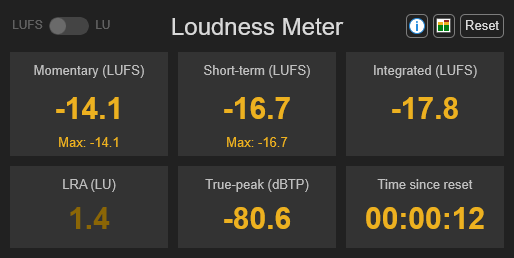
visualize( opens an 'EBU Mode'
loudness meter display. The values of momentary loudness, short-term loudness,
integrated loudness, loudness range, and true-peak are updated as the simulation
progresses. The display also shows the maximum value of momentary and short-term
loudness, and the time since the last call to loudMtr)reset.
hvsz = visualize(loudMtr)
Examples
Create a loudnessMeter System object™, and then call visualize to open an 'EBU Mode' loudness meter display.
loudMtr = loudnessMeter;
visualize(loudMtr)

Create an audio file reader System object and specify the audio file to analyze. Create an audio device writer System object to play the audio to your output device.
fileReader = dsp.AudioFileReader('RockDrums-48-stereo-11secs.mp3');
deviceWriter = audioDeviceWriter('SampleRate',fileReader.SampleRate);
In an audio stream loop, read the audio from the file and play it to your device. The loudness meter visualization updates at each call.
while ~isDone(fileReader)
    audioIn = fileReader();
    loudMtr(audioIn);
    deviceWriter(audioIn);
end
Input Arguments
Version History
Introduced in R2016b