Main Content

impzest

R2026b

Estimate impulse response of audio system

Description

ir = impzest(excitation,response) returns an estimate of the impulse response (IR) based on the excitation and response arguments.

example

ir = impzest(excitation,response,Name=Value) specifies additional options using one or more name-value arguments. Options include the number of warmup runs and the number of samples to pad edges of the recorded signal.

example

[ir,hir] = impzest(___) also returns the harmonic impulse responses (HIR) for any of the previous input syntaxes. hir contains the impulse responses for harmonics two and above. Specify NumHarmonics as an integer greater than 1 to use this syntax. (since R2026b)

example

impzest(___) with no output arguments plots the magnitude responses associated with the IR or HIR for any of the previous input syntaxes. (since R2026b)

example

Examples

collapse all

Create a sweep tone excitation signal with a sweep that goes from 20 Hz to 20 kHz for approximately 2 seconds and ends with a 1-second silence. Specify the sample rate as 44.1 kHz.

exc = sweeptone(2,1,44100,SweepFrequencyRange=[20 20e3]);

plot((0:numel(exc)-1)/44100,exc)
title("Excitation")
xlabel("Time (seconds)")
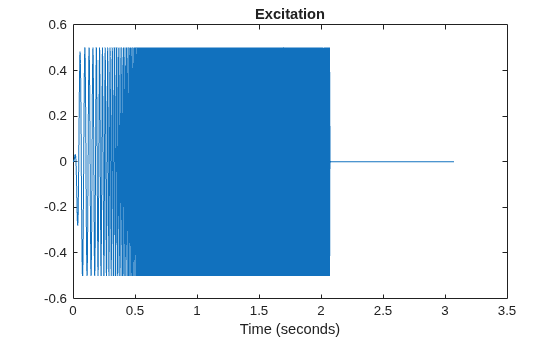
Figure contains an axes object. The axes object with title Excitation, xlabel Time (seconds) contains an object of type line.

Pass the excitation signal through an infinite impulse response (IIR) filter and add noise to model a real-world recording (system response).

[B,A] = butter(10,[0.1 0.7],"ctf");
rec = ctffilt(B,A,exc);
nrec = rec + 0.12*randn(size(rec));

plot((0:numel(nrec)-1)/44100,nrec)
title("System Response")
xlabel("Time (seconds)")
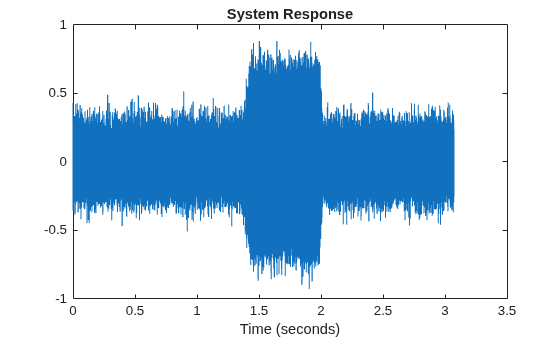
Figure contains an axes object. The axes object with title System Response, xlabel Time (seconds) contains an object of type line.

Pass the excitation signal and the system response to the impzest function to estimate the impulse response. Truncate the estimate to 100 points. Use impz to determine the true impulse response of the system. Plot the true impulse response and the estimated impulse response for comparison.

irEstimate = impzest(exc,nrec);
irEstimate = irEstimate(1:101);

irTrue = impz(B,A,101);
plot(0:100,irEstimate,"-",0:100,irTrue,"--")

legend(["True" "Estimated"] + " impulse response")
xlabel("Sample Number")
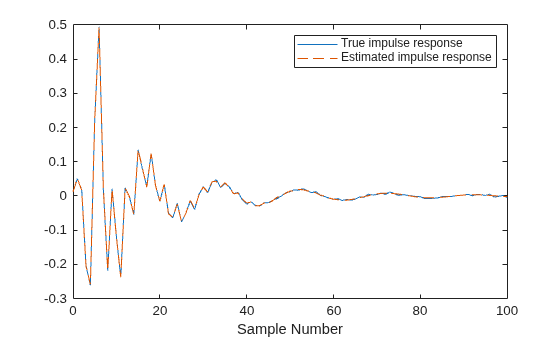
Figure contains an axes object. The axes object with xlabel Sample Number contains 2 objects of type line. These objects represent True impulse response, Estimated impulse response.

Use audioread to read in an impulse response recording. Create a dsp.FrequencyDomainFIRFilter object to perform frequency domain filtering using the known impulse response.

[irKnown,fs] = audioread("ChurchImpulseResponse-16-44p1-mono-5secs.wav");
systemModel = dsp.FrequencyDomainFIRFilter(irKnown');

Create an MLS excitation signal by using the mls function. The MLS excitation signal must be longer than the impulse response. Note that the length of the MLS excitation is extended to the next power of two minus one.

excitation = mls(numel(irKnown)+1);

plot(excitation)
title("Excitation")
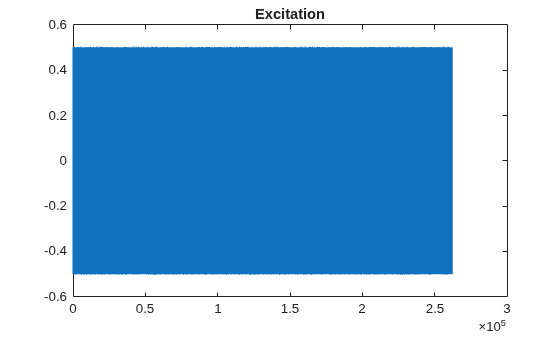
Figure contains an axes object. The axes object with title Excitation contains an object of type line.

Replicate the excitation signal four times to measure the average of three measurements. The recording of the first MLS sequence does include all the impulse response information, so impzest discards it as a warmup run. Pad the excitation signal with zeros to account for the filter latency.

numRuns = 4;
excrep = repmat(excitation,numRuns,1);
excrep = [excrep;zeros(numel(irKnown)+1,1)];

Pass the excitation signal through the known filter and then add noise to model a real-word recording (system response). Cut the delay introduced at the beginning by the filter.

rec = systemModel(excrep);
rec = rec + 0.1*randn(size(rec));

rec = rec(numel(irKnown)+2:end,:);

plot(rec)
title("System Response")
Figure contains an axes object. The axes object with title System Response contains an object of type line.

In a real-world scenario, the MLS sequence is played back in the system under test while recording. The recording would be cut so that it begins at the moment the MLS sequence is picked-up and truncated to last the duration of the repeated sequence.

Pass the excitation signal and the system response to the impzest function to estimate the impulse response. Use two warmup runs to compute the response. Plot the known impulse response and the simulation of the estimated impulse response for comparison.

irEstimate = impzest(excitation,rec,WarmupRuns=2);

samples = 1:numel(irKnown);
plot(samples,irEstimate(samples),"o", ...
     samples,irKnown(samples),".")

legend(["Known" "Simulation of estimated"] + " impulse response")
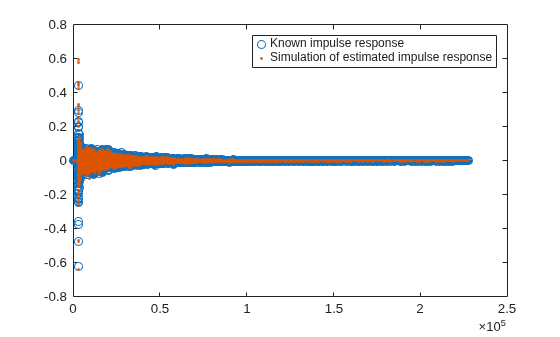
Figure contains an axes object. The axes object contains 2 objects of type line. One or more of the lines displays its values using only markers These objects represent Known impulse response, Simulation of estimated impulse response.

Since R2026b

Generate a sweep tone excitation with a 10-second target duration and 1-second silence. The sample rate is 192 kHz. The frequency sweep ranges from 1 kHz to 20 kHz. Considering the highest value of the frequency sweep range, the sample rate is more than twice the fourth-harmonic frequency to avoid aliasing from the simulated nonlinear system.

Fs = 192e3;
fRange = [1e3 20e3];
x20 = sweeptone(10,1,Fs,SweepFrequencyRange=fRange);

Generate a nonlinear system and pass the sweep tone excitation as the test signal. Add second, third, and fourth harmonics. The linear component and each nonlinear component has a different frequency response.

b = [0.2 -0.38 0.18; 0.2 -0.38 0.18; 0.04 -0.082 0.04; 0.1  -0.2  0.1];
a = [1.0 -1.90 0.94; 1.0 -1.88 0.92; 1.00 -1.83  0.95; 1.0 -1.85 0.93];
nls = @(x) filter(b(1,:),a(1,:),x) + filter(b(2,:),a(2,:),x.^2) + ...
           filter(5*b(3,:),a(3,:),x.^3) + filter(b(4,:),a(4,:),x.^4);
xrec = nls(x20);

Plot the magnitude response estimates of the nonlinear system up to the fourth harmonic.

impzest(x20,xrec,NumHarmonics=4, ...
    PaddingLength=8192,SampleRate=Fs,SweepFrequencyRange=fRange)
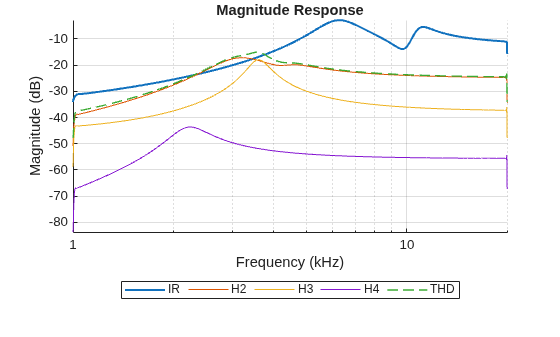
Figure contains an axes object. The axes object with title Magnitude Response, xlabel Frequency (kHz), ylabel Magnitude (dB) contains 5 objects of type line. These objects represent IR, H2, H3, H4, THD.

Input Arguments

collapse all

Single period of excitation signal input to audio system, specified as a column vector.

To generate excitation signals, use mls (maximum length sequence) or sweeptone (exponential sine sweep).

Data Types: single | double

Recorded signal output from audio system, specified as a column vector or matrix. If specified as a matrix, the function treats each column of the matrix as an independent channel.

Name-Value Arguments

collapse all

Specify optional pairs of arguments as Name1=Value1,...,NameN=ValueN, where Name is the argument name and Value is the corresponding value. Name-value arguments must appear after other arguments, but the order of the pairs does not matter.

Example: [ir,hir] = impzest(x,y,WarmupRuns=2)

Number of warmup runs in the response, specified as a nonnegative integer. The impzest function estimates the impulse response after discarding the specified number of warmup runs from the response.

The default number of warmup runs depends on whether you generated the excitation signal using the mls or sweeptone function:

  • mls –– 1

  • sweeptone –– 0

Data Types: single | double

Since R2026b

Number of harmonics to include in the harmonic impulse response estimate, specified as a positive integer. When you specify NumHarmonics = nh:

  • The function returns the estimated impulse response of the first harmonic as ir.

  • The function returns the estimated impulse responses of the second, third, …, and nhth harmonic as hir.

  • High-order harmonics are more likely to be masked by noise. As a result, you might get inaccurate results for the impulse responses from the 20th harmonic or higher.

The function uses this argument only if you generate excitation using the sweeptone function.

Since R2026b

Sample rate in Hz, specified as a positive scalar. The impzest function uses this argument to estimate the harmonic impulse responses to return in hir.

Data Types: single | double

Since R2026b

Range of sweep frequency in Hz, specified as a two-element positive-valued row vector. The impzest function uses this argument to estimate the harmonic impulse responses to return in hir.

  • You can specify the sweep frequency range as low to high or high to low. For example, [10 22000] and [22000 10] are both valid inputs.

  • Specify this argument to skip the automatic harmonic spacing detection, which can speed up computation and improve numeric precision. If you specify SweepFrequencyRange, you must also specify SampleRate.

  • The largest value of the sweep frequency range must be less than or equal to half the sample rate. To keep the frequencies of the harmonics below the Nyquist frequency, specify SweepFrequencyRange = fRange, NumHarmonics = nh, and SampleRate = Fs so that max(fRange)*nh is less than or equal to Fs/2.

Data Types: single | double

Since R2026b

Number of samples to pad the edges of the recorded signal, specified as a nonnegative even integer.

When you specify PaddingLength = p, the impzest function adds p/2 zero-valued samples on each edge of the recorded signal before deconvolution. Then, the function applies a Kaiser-Bessel-derived window of p points with tuning parameter β = 3 to the edges of the resulting impulse response and harmonic impulse responses. This processing has these effects on the outputs:

  • The impulse response peaks are shifted by p/2 samples in ir and each element of hir.

  • The length of ir increases by p samples compared to when p is zero.

  • The length of each element of hir decreases by up to p/2 samples compared to when p is zero.

This processing helps avoid rectangular-window artifacts that can occur with very low latency responses.

Since R2026b

Target parent container, specified as an Axes object, a UIAxes object, or a Panel object.

If you specify Parent, the impzest function plots the magnitude responses associated with the IR or HIR, whether you call the function with or without output arguments. If you do not specify Parent and you do not specify output arguments, the function plots to the axes returned by newplot.

For more information about target containers and the parent-child relationship in MATLAB® graphics, see Graphics Object Hierarchy.

Output Arguments

collapse all

Estimated linear impulse response of the audio system, returned as a column vector or matrix. The size of ir is L-by-C, where:

  • L –– MLS length or duration of sweep tone silence

  • C –– Number of columns (channels) in the response signal

Data Types: single | double

Since R2026b

Estimated higher-order harmonic impulse responses of the audio system, returned as a cell array.

  • The function sorts the elements of the cell array hir by harmonic number from the second harmonic up to NumHarmonics.

  • Each element of hir is a column vector or matrix.

The function returns this argument only if you generate excitation using the sweeptone function.

Data Types: single | double

References

[1] Farina, Angelo. "Advancements in Impulse Response Measurements by Sine Sweeps." Presented at the Audio Engineering Society 122nd Convention, Vienna, Austria, 2007.

[2] Guy-Bart, Stan, Jean-Jacques Embrachts, and Dominique Archambeau. "Comparison of Different Impulse Response Measurement Techniques." Journal of Audio Engineering Society. Vol. 50, Issue 4, 2002, pp. 246–262.

[3] Armelloni, Enrico, Christian Giottoli, and Angelo Farina. "Implementation of Real-Time Partitioned Convolution on a DSP Board." Application of Signal Processing to Audio and Acoustics, 2003 IEEE Workshop, pp. 71–74. IEEE, 2003.

Extended Capabilities

expand all

C/C++ Code Generation
Generate C and C++ code using MATLAB® Coder™.

Version History

Introduced in R2018b

expand all