acousticRoomResponse
Description
Examples
Specify the dimensions of a simple shoebox room. The first dimension is the length along the x-axis, the second dimension is the width along the y-axis, and the third dimension is the height along the z-axis.
roomDimensions = [5, 4, 6];
Specify the cartesian coordinates of the receiver and source within the room.
rx = [2, 3.5, 2];
tx = [2, 1.5, 2];
Synthesize the impulse response.
ir = acousticRoomResponse(roomDimensions,tx,rx);
Plot the impulse response.
fs = 16e3;
t = (0:numel(ir)-1)/fs;
plot(t,ir)
xlabel("Time (s)")
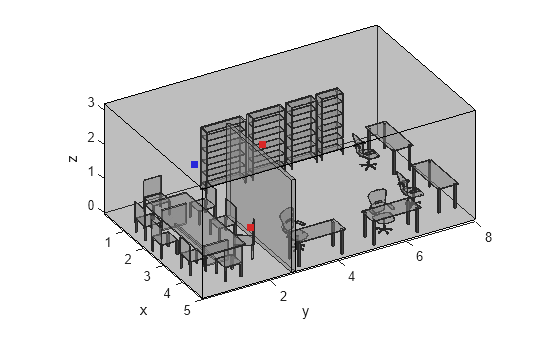
Read in a triangulation object from an STL file using stlread. Define the coordinates of the transmitter and two receivers. Use the viewScene helper function to visualize the room with the transmitter represented as a blue point and the receivers as red points.
room = stlread("office.stl");
tx = [2, 1.5, 2];
rx = [2, 3.5, 2; 4, 2, 1];
viewScene(room,tx,rx)
Use acousticRoomResponse to synthesize the impulse response for both receivers. Set the ImageSourceOrder to 2, because the default of 3 is too high for this complex scene.
ir = acousticRoomResponse(room,tx,rx,ImageSourceOrder=2);
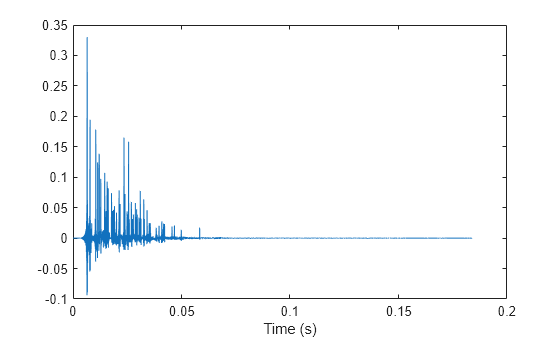
Filter an audio signal using the first impulse response. Plot the impulse response and listen to the filtered audio. The impulse response for this microphone has no direct line-of-sight to the transmitter, and the sound must reflect around the wall.
[x,fs] = audioread("MaleVolumeUp-16-mono-6secs.ogg");
y1 = filter(ir(1,:),1,x);
sound(y1,fs)

t = (0:length(ir)-1)/fs;
plot(t,ir(1,:))
xlabel("Time (s)")

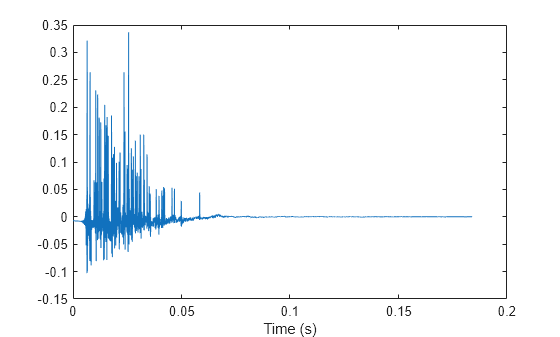
Filter the same signal using the impulse response from the other microphone and listen to the difference. Plot the impulse response. The microphone associated with this impulse response has a direct line-of-sight to the transmitter.
y2 = filter(ir(2,:),1,x);
sound(y2,fs)

plot(t,ir(2,:))
xlabel("Time (s)")
Supporting Function
function viewScene(room,tx,rx)
% Helper function to visualize scene with source and receiver locations.
trisurf(room,FaceAlpha=0.3,FaceColor=[.5 .5 .5],EdgeColor="none");
view(60, 30);
hold on; axis equal; grid off;
xlabel("x"); ylabel("y"); zlabel("z");
% Plot edges
fe = featureEdges(room,pi/20);
numEdges = size(fe, 1);
pts = room.Points;
a = pts(fe(:,1),:);
b = pts(fe(:,2),:);
fePts = cat(1, reshape(a,1,numEdges,3),reshape(b, 1, numEdges, 3), ...
    nan(1,numEdges,3));
fePts = reshape(fePts,[],3);
plot3(fePts(:,1),fePts(:,2),fePts(:,3),"k",LineWidth=.5);
scatter3(tx(1),tx(2),tx(3),"sb","filled");
scatter3(rx(:,1),rx(:,2),rx(:,3),"sr","filled");
hold off
end
Define the dimensions of a shoebox room and the coordinates of the transmitter and receiver. Use acousticRoomResponse to synthesize the impulse response with custom absorption and scattering coefficients for the walls of the room. Plot the synthesized response.
roomDimensions = [6, 5, 2.5];
tx = [3, 3, 1.8];
rx = [5, 4, 1.7];

ir = acousticRoomResponse(roomDimensions,tx,rx,MaterialAbsorption=.5,MaterialScattering=0.07);
fs = 16e3;
t = (0:numel(ir)-1)/fs;
plot(t,ir)
xlabel("Time (s)")
Call acousticRoomResponse with the absorption and scattering coefficients set to column vectors to specify the characteristic for each of the surfaces, which are the floor, front, back, left, right, and ceiling of the shoebox room. Plot the resulting impulse response.
ir = acousticRoomResponse(roomDimensions,tx,rx,...
                          MaterialAbsorption=[.05, .06, .05, .07, .08, .1].',...
                          MaterialScattering=[.7, .6, .7, .6, .7, .6].');
plot(t,ir)
xlabel("Time (s)")

Call acousticRoomResponse with the absorption and scattering coefficients set to row vectors to specify the characteristic for each of the frequencies specified by BandCenterFrequencies. Plot the resulting impulse response. You can also specify the coefficients as matrices to define the characteristic for each combination of surface and frequency band.
ir = acousticRoomResponse(roomDimensions,tx,rx,...
                          MaterialAbsorption=[.015, .015, .02, .02, .03, .03, .04, .05, .05],...
                          MaterialScattering=[.2, .2, .3, .5, .6, .6, .7, .7, .7],...
                          BandCenterFrequencies=[31.125, 62.5, 125, 250, 500, 1000, 2000, 4000, 8000]);
plot(t,ir)
xlabel("Time (s)")

Input Arguments
The room representation used to synthesize the impulse response, specified as a
1-by-3 vector or a triangulation object. If you provide a
1-by-3 vector, [L
W
H], then the room is a shoebox room with length
L along the x-axis, width W along the y-axis,
and height H along the z-axis, where all units are in meters. You can
create a triangulation object to represent the room using delaunayTriangulation or you can read in an STL file using stlread.
Cartesian coordinates of the transmitter in meters, specified as a 1-by-3 vector.
Data Types: single | double
Cartesian coordinates of the receiver in meters, specified as an N-by-3 vector, where N is the number of receivers.
Data Types: single | double
Name-Value Arguments
Specify optional pairs of arguments as
Name1=Value1,...,NameN=ValueN, where Name is
the argument name and Value is the corresponding value.
Name-value arguments must appear after other arguments, but the order of the
pairs does not matter.
Example: ir =
acousticRoomResponse(room,tx,rx,ImageSourceOrder=5)
Sample rate of the impulse response in Hertz, specified as a positive scalar.
Data Types: single | double | int8 | int16 | int32 | int64 | uint8 | uint16 | uint32 | uint64
Speed of sound in meters per second, specified as a positive scalar.
Data Types: single | double | int8 | int16 | int32 | int64 | uint8 | uint16 | uint32 | uint64
Impulse response synthesis algorithm specified as
"image-source", "stochastic ray tracing", or
"hybrid".
Set
Algorithmto"image-source"to use the image-source method for synthesizing the impulse response [1]. For more information about the image-source algorithm, see Room Impulse Response Simulation with the Image-Source Method and HRTF Interpolation.Set
Algorithmto"stochastic ray tracing"to use stochastic ray tracing to synthesize the impulse response [3]. For more information about this algorithm, see Room Impulse Response Simulation with Stochastic Ray Tracing.Set
Algorithmto"hybrid"to combine the image-source and stochastic ray tracing methods to synthesize the impulse response.
Data Types: char | string
Image-source maximum order, specified as a nonnegative integer. The order specifies the maximum number of reflections a ray can make by bouncing off multiple surfaces before reaching the receiver. A higher image-source order increases the computational complexity of this method.
This argument applies only when Algorithm is
"image-source" or "hybrid".
Data Types: single | double | int8 | int16 | int32 | int64 | uint8 | uint16 | uint32 | uint64
Number of rays to use for the stochastic ray tracing method, specified as a nonnegative integer. A higher number of rays increases the accuracy of the impulse response but also increases the computational complexity of this method.
This argument applies only when Algorithm is
"stochastic ray tracing" or "hybrid".
Data Types: single | double | int8 | int16 | int32 | int64 | uint8 | uint16 | uint32 | uint64
Maximum number of reflections per stochastic ray, specified as a nonnegative
integer. This argument applies only when Algorithm is
"stochastic ray tracing" or "hybrid".
Data Types: single | double | int8 | int16 | int32 | int64 | uint8 | uint16 | uint32 | uint64
Radius of the spherical receiver in meters, specified as a nonnegative scalar.
This argument applies only when Algorithm is
"stochastic ray tracing" or "hybrid".
Data Types: single | double | int8 | int16 | int32 | int64 | uint8 | uint16 | uint32 | uint64
Air absorption coefficient, specified as a scalar in the range [0,1]. You can also
specify this argument as a vector to define the air absorption coefficients for each
of the BandCenterFrequencies.
Data Types: single | double
Material absorption coefficients, specified as a 1-by-N vector,
M-by-N matrix, or M-by-1
vector of values in the range [0,1], where N is the number of
frequency bands specified by BandCenterFrequencies and
M is the number of surfaces in the room. For
triangulation objects, M corresponds to the
number of triangles. The absorption coefficient describes the proportion of energy
lost during reflection.
Data Types: single | double
Material scattering coefficients, specified as a 1-by-N vector,
M-by-N matrix, or M-by-1
vector of values in the range [0,1], where N is the number of
frequency bands specified by BandCenterFrequencies and
M is the number of surfaces in the room. For
triangulation objects, M corresponds to the
number of triangles. The scattering coefficient describes the proportion of energy
that is scattered as opposed to perfectly reflected when bouncing off a
surface.
Data Types: single | double
Center frequencies of the bandpass filters in Hertz, specified as a vector of positive values.
Data Types: single | double
Output Arguments
Impulse response, returned as an N-by-L matrix
where N is the number of microphones specified by
rx, and L is the length of the impulse
response, which depends on the SampleRate,
Algorithm, and the characteristics of the room.
References
[1] Allen, Jont B., and David A. Berkley. “Image Method for Efficiently Simulating Small-Room Acoustics.” The Journal of the Acoustical Society of America 65, no. 4 (April 1, 1979): 943–50. https://doi.org/10.1121/1.382599.
[2] Peterson, Patrick M. “Simulating the Response of Multiple Microphones to a Single Acoustic Source in a Reverberant Room.” The Journal of the Acoustical Society of America 80, no. 5 (November 1, 1986): 1527–29. https://doi.org/10.1121/1.394357.
[3] Schröder, Dirk. “Physically Based Real-Time Auralization of Interactive Virtual Environments.” PhD Thesis, RWTH Aachen University, 2011.
Version History
Introduced in R2025a
MATLAB Command
You clicked a link that corresponds to this MATLAB command:
Run the command by entering it in the MATLAB Command Window. Web browsers do not support MATLAB commands.
Select a Web Site
Choose a web site to get translated content where available and see local events and offers. Based on your location, we recommend that you select: .
You can also select a web site from the following list
How to Get Best Site Performance
Select the China site (in Chinese or English) for best site performance. Other MathWorks country sites are not optimized for visits from your location.
Americas
- América Latina (Español)
- Canada (English)
- United States (English)
Europe
- Belgium (English)
- Denmark (English)
- Deutschland (Deutsch)
- España (Español)
- Finland (English)
- France (Français)
- Ireland (English)
- Italia (Italiano)
- Luxembourg (English)
- Netherlands (English)
- Norway (English)
- Österreich (Deutsch)
- Portugal (English)
- Sweden (English)
- Switzerland
- United Kingdom (English)