EVM Measurement of 5G NR Downlink Waveforms with RF Impairments
This example shows how to measure the error vector magnitude (EVM) of NR test model (NR-TM) or fixed reference channel (FRC) waveforms. The example also shows how to add RF impairments, including phase noise, in-phase and quadrature (I/Q) imbalance, filter effects, and memoryless nonlinearity.
Introduction
For base station RF testing, the 3GPP 5G NR standard defines a set of NR-TM waveforms. For user equipment (UE) testing, the standard defines a set of FRC waveforms. The NR-TMs and FRCs for frequency range 1 (FR1) are defined in TS 38.141-1 while the NR-TMs and FRCs for frequency range 2 (FR2) are defined in TS 38.141-2.
This example shows how to generate an NR waveform (TM or FRC), add RF impairments, such as, phase noise, I/Q imbalance, filter effects, and memoryless nonlinearities, and calculate the EVM of the resulting signal. The example plots the RMS and peak EVMs per orthogonal frequency division multiplexing (OFDM) symbol, slot, and subcarrier and also calculates the overall EVM (RMS EVM averaged over the complete waveform). Annex B and Annex C of TS 38.104 define an alternative method for computing the EVM in FR1 and FR2, respectively. This figure shows the processing chain implemented in this example.
Simulation Parameters
Each NR-TM or FRC waveform is defined by a combination of these parameters:
NR-TM/FRC name
Channel bandwidth
Subcarrier spacing
Duplexing mode
rc ="NR-FR1-TM3.2"; % Reference channel (NR-TM or FRC) % Select the NR waveform parameters bw =
"10MHz"; % Channel bandwidth scs =
"30kHz"; % Subcarrier spacing dm =
"FDD"; % Duplexing mode
For TMs, the generated waveform may contain more than one physical downlink shared channel (PDSCH). The chosen PDSCH to analyse is based on the radio network temporary identifier (RNTI). By default, these RNTIs are considered for EVM calculation:
NR-FR1-TM2: RNTI = 2 (64QAM EVM)
NR-FR1-TM2a: RNTI = 2 (256QAM EVM)
NR-FR1-TM2b: RNTI = 2 (1024QAM EVM)
NR-FR1-TM3.1: RNTI = 0 and 2 (64QAM EVM)
NR-FR1-TM3.1a: RNTI = 0 and 2 (256QAM EVM)
NR-FR1-TM3.1b: RNTI = 0 and 2 (1024QAM EVM)
NR-FR1-TM3.2: RNTI = 1 (16QAM EVM)
NR-FR1-TM3.3: RNTI = 1 (QPSK EVM)
NR-FR2-TM2: RNTI = 2 (64QAM EVM)
NR-FR2-TM2a: RNTI = 2 (256QAM EVM)
NR-FR2-TM3.1: RNTI = 0 and 2 (64QAM EVM)
NR-FR2-TM3.1a: RNTI = 0 and 2 (256QAM EVM)
As per the specifications (TS 38.141-1, TS 38.141-2), these TMs are not designed to perform EVM measurements: NR-FR1-TM1.1, NR-FR1-TM1.2, NR-FR2-TM1.1. However, if you generate these TMs, the example measures the EVM for the following RNTIs.
NR-FR1-TM1.1: RNTI = 0 (QPSK EVM)
NR-FR1-TM1.2: RNTI = 2 (QPSK EVM)
NR-FR2-TM1.1: RNTI = 0 (QPSK EVM)
For PDSCH FRCs and physical downlink control channel (PDCCH), by default, RNTI 0 is considered for EVM calculation.
The example calculates the PDSCH EVM for the RNTIs listed above. To override the default PDSCH RNTIs, specify the targetRNTIs vector.
targetRNTIs = [];
To print EVM statistics, set displayEVM to true. To disable the prints, set displayEVM to false. To plot EVM statistics, set plotEVM to true. To disable the plots, set plotEVM to false.
displayEVM =true; plotEVM =
true;
if displayEVM
    fprintf('Reference Channel = %s\n', rc);
end
Reference Channel = NR-FR1-TM3.2
To measure EVM as defined in TS 38.104, Annex B(FR1) / Annex C(FR2), set evm3GPP to true. evm3GPP is disabled by default. evm3GPP is disabled for PDCCH EVM measurement.
evm3GPP =  false;
This example considers the most typical impairments that distort the waveform when passing through an RF transmitter or receiver: phase noise, I/Q imbalance, filter effects and memoryless nonlinearity. Enable or disable impairments by toggling the flags phaseNoiseOn, IQImbalanceON, filterOn, and nonLinearityModelOn.
phaseNoiseOn =true; IQImbalanceON =
true; filterOn =
true; nonLinearityModelOn =
true;
To model wideband filter effects, specify a higher waveform sample rate. You can increase the sample rate by multiplying the nominal sample rate with the oversampling factor, OSR. To use the nominal sample rate, set OSR to 1.
OSR = 5; % oversampling factor

% Create waveform generator object
tmwavegen = hNRReferenceWaveformGenerator(rc,bw,scs,dm);

% Waveform bandwidth
bandwidth = tmwavegen.Config.ChannelBandwidth*1e6;

if OSR > 1
    % The |Config| property in |tmwavegen| specifies the configuration of
    % the standard-defined reference waveform. It is a read-only property.
    % To customize the waveform, make the |Config| property writable.
    tmwavegen = makeConfigWritable(tmwavegen);

    % Increase the waveform sample rate by multiplying the nominal sample
    % rate with |OSR|
    nominalSampleRate = getNominalSampleRate(tmwavegen.Config);
    tmwavegen.Config.SampleRate = nominalSampleRate*OSR;
else
    filterOn = false;
end

% Generate the waveform and get the waveform sample rate
[txWaveform,tmwaveinfo,resourcesinfo] = generateWaveform(tmwavegen,tmwavegen.Config.NumSubframes);
sr = tmwaveinfo.Info.SamplingRate; % waveform sample rate
Normalize the waveform to fit the dynamic range of the nonlinearity.
txWaveform = txWaveform/max(abs(txWaveform),[],'all');The waveform consists of one frame for frequency division duplex (FDD) and two for time division duplex (TDD). Repeat the signal twice. Remove the first half of the resulting waveform to avoid the transient introduced by the phase noise model.
txWaveform = repmat(txWaveform,2,1);
RF Impairments
This section shows how to model these RF impairments: phase noise, I/Q imbalance, filter effects, and nonlinearity.
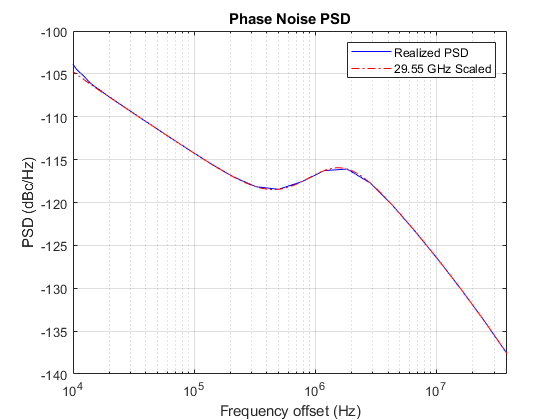
Introduce phase noise distortion. The figure shows the phase noise characteristic. The carrier frequency that is considered in the example depends on the frequency range. This example uses the center frequency values of 4 GHz and 30 GHz for FR1 and FR2, respectively. The phase noise characteristic is generated with the multipole zero model described in TR 38.803 Section 6.1.10. Set the MinFrequencyOffset property to a smaller value to improve the match between the realized and recommended power spectral density (PSD), with a trade-off of increased simulation time.
if phaseNoiseOn
    % Carrier frequency
    if tmwavegen.Config.FrequencyRange == "FR1" % carrier frequency for FR1
        fc = 4e9;
    else % carrier frequency for FR2
        fc = 30e9;
    end

    % Model phase noise
    pnoise = nrPhaseNoise(CarrierFrequency=fc, ...
        SampleRate=sr, ...
        MinFrequencyOffset=1e4,...
        RandomStream="mt19937ar");             % dBc/Hz, PoleZeroModel='TR38.803-auto'

    % Visualize spectrum mask of phase noise
    visualize(pnoise)

    % Apply phase noise to the waveform
    rxWaveform = pnoise(txWaveform);
    release(pnoise)
else
    rxWaveform = txWaveform; %#ok<UNRCH>
end
To introduce I/Q imbalance, apply a 0.2 dB amplitude imbalance and a 0.5 degree phase imbalance to the waveform. You can also increase the amplitude and phase imbalances by setting amplitudeImbalance and phaseImbalance to higher values.
if IQImbalanceON
    amplitudeImbalance = 0.2;
    phaseImbalance = 0.5;
    rxWaveform = iqimbal(rxWaveform,amplitudeImbalance,phaseImbalance);
end
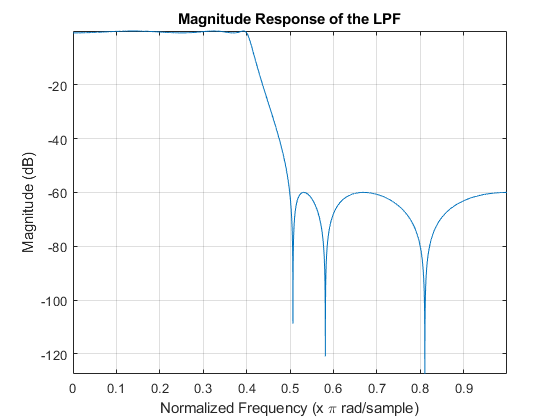
To filter the baseband waveform, use a low-pass filter. If the use of the current passband and stopband frequencies, PassbandFrequency and StopbandFrequency, results in high EVM values for a certain waveform bandwidth and OSR, use a wider filter by increasing PassbandFrequency and StopbandFrequency. To use a narrower filter, reduce PassbandFrequency and StopbandFrequency. You can also modify the passband ripple and the stopband attenuation. This figure shows the magnitude response of the low-pass filter.
if filterOn
    % Create low-pass filter object
    LPF = dsp.LowpassFilter('SampleRate',sr, ...
                            'FilterType','IIR', ...
                            'PassbandFrequency',sr/2-(sr/2*0.6), ...
                            'StopbandFrequency',sr/2-(sr/2*0.5), ...
                            'PassbandRipple',0.7, ...
                            'StopbandAttenuation',60);

    % Plot the magnitude response of the low-pass filter
    [h,w] = freqz(LPF);
    figure
    plot(w/pi,mag2db(abs(h)));
    axis('tight');
    grid;
    title('Magnitude Response of the LPF')
    xlabel('Normalized Frequency (x \pi rad/sample)');
    ylabel('Magnitude (dB)');

    % Filter the waveform
    rxWaveform = LPF(rxWaveform);
    release(LPF);
end
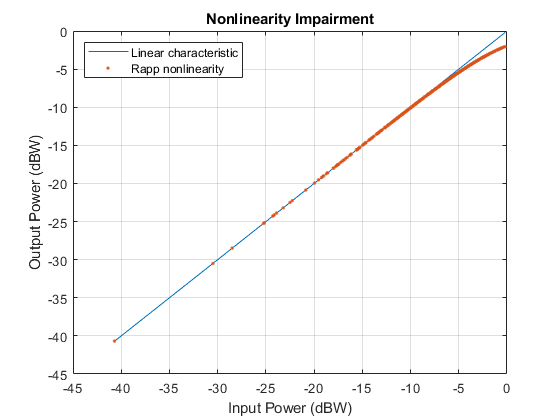
To introduce nonlinear distortion, use the modified Rapp model in this example. Set the parameters for the Modified Rapp model to match the characteristics of the memoryless model from TR 38.803 Annex A.1. The figure shows the introduced nonlinearity.
if nonLinearityModelOn
    % Generate Modified Rapp model object
    rapp = comm.MemorylessNonlinearity(Method="Modified Rapp model");
    rapp.Smoothness = 1.55;
    rapp.OutputSaturationLevel = 1;

    % Plot nonlinear characteristic
    plotNonLinearCharacteristic(rapp);

    % Apply nonlinearity
    rxWaveform = rapp(rxWaveform);
    release(rapp);
end
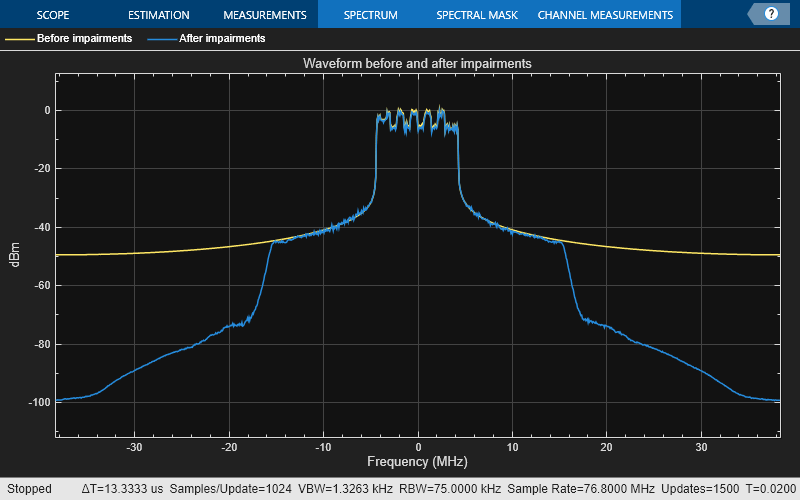
Plot the spectrum of the waveform before and after adding the RF impairments
scope = spectrumAnalyzer('SampleRate',sr,...
    'ChannelNames',{'Before impairments','After impairments'},...
    'Title', 'Waveform before and after impairments');
scope([txWaveform,rxWaveform]);
release(scope);
The signal was previously repeated twice. Remove the first half of this signal. This avoids any transient introduced by the impairment models.
if dm == "FDD"
    nFrames = 1;
else % TDD
    nFrames = 2;
end

rxWaveform(1:nFrames*tmwaveinfo.Info.SamplesPerSubframe*10,:) = [];
Measurements
The helper function hNRDownlinkEVM performs these steps to decode and analyze the waveform:
Coarse frequency offset estimation and correction
Integer frequency offset estimation and correction
I/Q imbalance estimation and correction
Synchronization using the demodulation reference signal (DM-RS) over one frame for FDD (two frames for TDD)
Direct current (DC) offset estimation and correction
OFDM demodulation of the received waveform
DC subcarrier exclusion
Fine frequency offset estimation and correction
Channel estimation
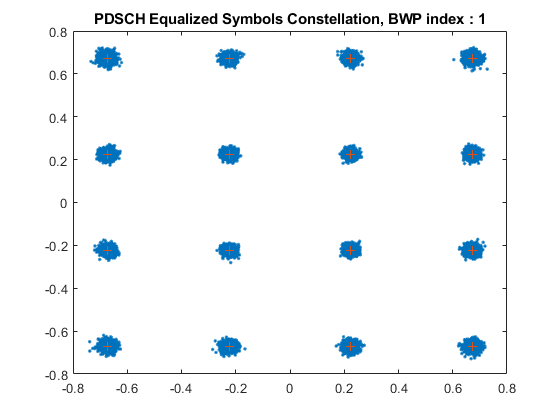
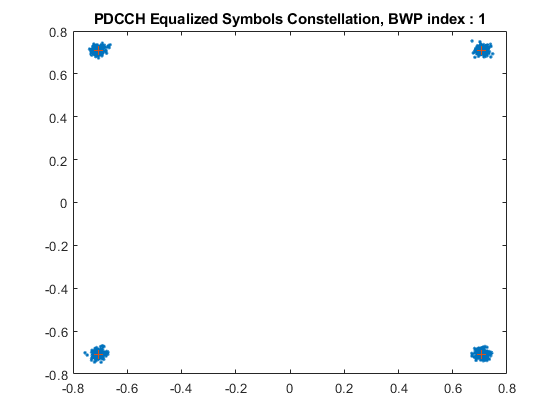
Equalization
Common phase error (CPE) estimation and compensation
PDSCH EVM computation (enable the switch
evm3GPP, to process according to the EVM measurement requirements specified in TS 38.104, Annex B (FR1) / Annex C (FR2)).PDSCH DM-RS EVM computation across each bandwidth part ( BWP)
PDSCH PT-RS EVM computation across each BWP
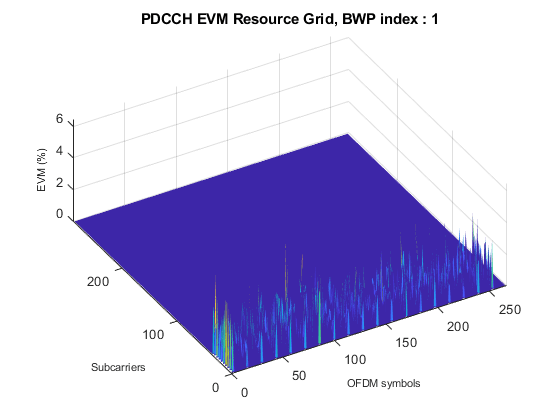
PDCCH EVM computation across each BWP
PDCCH DM-RS EVM computation across each BWP
PDSCH EVM computation for each PDSCH configuration
PDSCH power per resource element (RE) for each PDSCH configuration
PDSCH DM-RS EVM computation for each PDSCH configuration
PDSCH DM-RS power per RE for each PDSCH configuration
PDSCH PT-RS EVM computation for each PDSCH configuration
PDSCH PT-RS power per RE for each PDSCH configuration
PDCCH EVM computation for each PDCCH configuration
PDCCH power per RE for each PDCCH configuration
PDCCH DM-RS EVM computation for each PDCCH configuration
PDCCH DM-RS power per RE for each PDCCH configuration
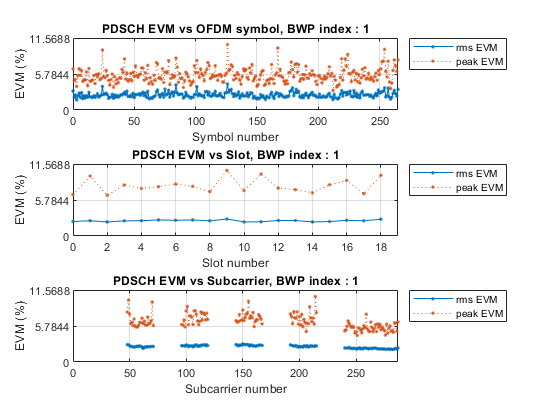
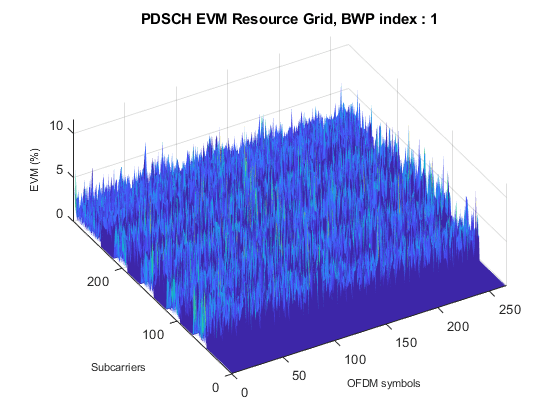
The example measures and outputs various EVM related statistics per symbol, per slot, and per frame peak EVM and RMS EVM. The example displays EVM for each slot and frame. It also displays the overall EVM averaged over the entire input waveform. The example produces a number of plots: EVM vs per OFDM symbol, slot, subcarrier, and overall EVM. Each plot displays the peak vs RMS EVM.
cfg = struct();
cfg.Evm3GPP = evm3GPP;
cfg.TargetRNTIs = targetRNTIs;
cfg.PlotEVM = plotEVM;
cfg.DisplayEVM = displayEVM;
cfg.IQImbalance = IQImbalanceON;

% Compute and display EVM measurements
[evmInfo,eqSym,refSym] = hNRDownlinkEVM(tmwavegen.Config,rxWaveform,cfg);
EVM stats for BWP idx : 1 PDSCH RMS EVM, Peak EVM, slot 0: 2.328 6.666% DM-RS RMS EVM, Peak EVM, slot 0: 1.656 3.912% PDSCH RMS EVM, Peak EVM, slot 1: 2.455 9.628% DM-RS RMS EVM, Peak EVM, slot 1: 1.815 3.739% PDSCH RMS EVM, Peak EVM, slot 2: 2.254 6.522% DM-RS RMS EVM, Peak EVM, slot 2: 1.892 5.122% PDSCH RMS EVM, Peak EVM, slot 3: 2.431 8.202% DM-RS RMS EVM, Peak EVM, slot 3: 2.175 5.190% PDSCH RMS EVM, Peak EVM, slot 4: 2.458 7.635% DM-RS RMS EVM, Peak EVM, slot 4: 1.961 6.181% PDSCH RMS EVM, Peak EVM, slot 5: 2.589 7.928% DM-RS RMS EVM, Peak EVM, slot 5: 2.114 5.070% PDSCH RMS EVM, Peak EVM, slot 6: 2.521 8.341% DM-RS RMS EVM, Peak EVM, slot 6: 1.826 4.415% PDSCH RMS EVM, Peak EVM, slot 7: 2.583 7.959% DM-RS RMS EVM, Peak EVM, slot 7: 2.330 5.338% PDSCH RMS EVM, Peak EVM, slot 8: 2.436 7.121% DM-RS RMS EVM, Peak EVM, slot 8: 1.675 5.060% PDSCH RMS EVM, Peak EVM, slot 9: 2.731 10.517% DM-RS RMS EVM, Peak EVM, slot 9: 2.022 4.807% PDSCH RMS EVM, Peak EVM, slot 10: 2.256 7.314% DM-RS RMS EVM, Peak EVM, slot 10: 1.895 3.755% PDSCH RMS EVM, Peak EVM, slot 11: 2.284 9.950% DM-RS RMS EVM, Peak EVM, slot 11: 1.695 4.039% PDSCH RMS EVM, Peak EVM, slot 12: 2.486 7.692% DM-RS RMS EVM, Peak EVM, slot 12: 2.254 6.078% PDSCH RMS EVM, Peak EVM, slot 13: 2.492 7.451% DM-RS RMS EVM, Peak EVM, slot 13: 1.862 5.556% PDSCH RMS EVM, Peak EVM, slot 14: 2.260 6.940% DM-RS RMS EVM, Peak EVM, slot 14: 1.721 5.189% PDSCH RMS EVM, Peak EVM, slot 15: 2.321 8.232% DM-RS RMS EVM, Peak EVM, slot 15: 1.784 4.540% PDSCH RMS EVM, Peak EVM, slot 16: 2.523 8.926% DM-RS RMS EVM, Peak EVM, slot 16: 2.422 6.150% PDSCH RMS EVM, Peak EVM, slot 17: 2.446 6.791% DM-RS RMS EVM, Peak EVM, slot 17: 2.248 5.218% PDSCH RMS EVM, Peak EVM, slot 18: 2.693 9.742% DM-RS RMS EVM, Peak EVM, slot 18: 2.447 8.232% PDCCH RMS EVM, Peak EVM, slot 0: 2.157 5.243% PDCCH DM-RS RMS EVM, Peak EVM, slot 0: 1.183 2.207% PDCCH RMS EVM, Peak EVM, slot 1: 1.349 2.476% PDCCH DM-RS RMS EVM, Peak EVM, slot 1: 0.777 1.370% PDCCH RMS EVM, Peak EVM, slot 2: 1.687 4.359% PDCCH DM-RS RMS EVM, Peak EVM, slot 2: 0.805 1.116% PDCCH RMS EVM, Peak EVM, slot 3: 1.717 3.739% PDCCH DM-RS RMS EVM, Peak EVM, slot 3: 0.961 1.728% PDCCH RMS EVM, Peak EVM, slot 4: 2.012 3.641% PDCCH DM-RS RMS EVM, Peak EVM, slot 4: 0.707 1.137% PDCCH RMS EVM, Peak EVM, slot 5: 1.784 5.852% PDCCH DM-RS RMS EVM, Peak EVM, slot 5: 0.684 1.252% PDCCH RMS EVM, Peak EVM, slot 6: 2.485 4.889% PDCCH DM-RS RMS EVM, Peak EVM, slot 6: 0.906 1.396% PDCCH RMS EVM, Peak EVM, slot 7: 1.557 3.589% PDCCH DM-RS RMS EVM, Peak EVM, slot 7: 0.625 1.182% PDCCH RMS EVM, Peak EVM, slot 8: 1.531 3.197% PDCCH DM-RS RMS EVM, Peak EVM, slot 8: 0.740 1.015% PDCCH RMS EVM, Peak EVM, slot 9: 1.905 4.610% PDCCH DM-RS RMS EVM, Peak EVM, slot 9: 0.700 1.205% PDCCH RMS EVM, Peak EVM, slot 10: 1.298 3.273% PDCCH DM-RS RMS EVM, Peak EVM, slot 10: 0.764 1.166% PDCCH RMS EVM, Peak EVM, slot 11: 1.556 3.975% PDCCH DM-RS RMS EVM, Peak EVM, slot 11: 0.890 1.675% PDCCH RMS EVM, Peak EVM, slot 12: 1.657 3.378% PDCCH DM-RS RMS EVM, Peak EVM, slot 12: 0.649 1.198% PDCCH RMS EVM, Peak EVM, slot 13: 1.946 3.974% PDCCH DM-RS RMS EVM, Peak EVM, slot 13: 0.820 1.321% PDCCH RMS EVM, Peak EVM, slot 14: 1.725 4.251% PDCCH DM-RS RMS EVM, Peak EVM, slot 14: 0.679 1.269% PDCCH RMS EVM, Peak EVM, slot 15: 1.540 3.703% PDCCH DM-RS RMS EVM, Peak EVM, slot 15: 0.520 0.832% PDCCH RMS EVM, Peak EVM, slot 16: 1.530 3.719% PDCCH DM-RS RMS EVM, Peak EVM, slot 16: 0.772 1.261% PDCCH RMS EVM, Peak EVM, slot 17: 1.635 3.319% PDCCH DM-RS RMS EVM, Peak EVM, slot 17: 0.871 1.351% PDCCH RMS EVM, Peak EVM, slot 18: 1.767 3.754% PDCCH DM-RS RMS EVM, Peak EVM, slot 18: 0.898 2.015%
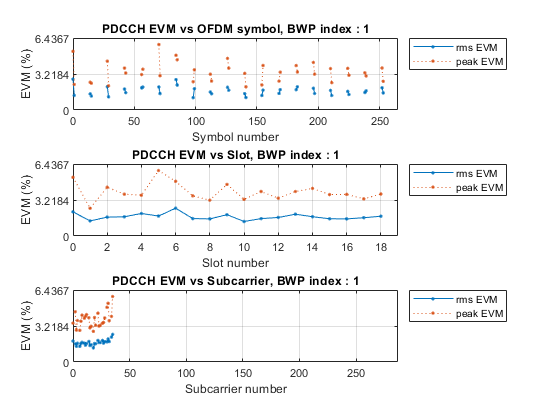

Averaged overall PDSCH RMS EVM: 2.454%
Overall PDSCH Peak EVM = 10.5171%
Averaged overall PDCCH RMS EVM: 1.750%
Overall PDCCH Peak EVM = 5.8516%
References
[1] TR 38.803 V14.3.0. "Study on new radio access technology: Radio Frequency (RF) and co-existence aspects." 3rd Generation Partnership Project; Technical Specification Group Radio Access Network.
[2] TS 38.141-1. "NR; Base Station (BS) conformance testing Part 1: Conducted conformance testing." 3rd Generation Partnership Project; Technical Specification Group Radio Access Network.
[3] TS 38.141-2. "NR; Base Station (BS) conformance testing Part 2: Conducted conformance testing." 3rd Generation Partnership Project; Technical Specification Group Radio Access Network.
[4] TS 38.104. "NR; Base Station (BS) radio transmission and reception." 3rd Generation Partnership Project; Technical Specification Group Radio Access Network.
Local Functions
function plotNonLinearCharacteristic(memoryLessNonlinearity)
    % Plot the nonlinear characteristic of the power amplifier (PA) impairment
    % represented by the input parameter memoryLessNonlinearity, which is a
    % comm.MemorylessNonlinearity Communications Toolbox(TM) System object.

    % Input samples
    x = complex((1/sqrt(2))*(-1+2*rand(1000,1)),(1/sqrt(2))*(-1+2*rand(1000,1)));

    % Nonlinearity
    yRapp = memoryLessNonlinearity(x);

    % Release object to feed it a different number of samples
    release(memoryLessNonlinearity);

    % Plot characteristic
    figure;
    plot(10*log10(abs(x).^2),10*log10(abs(x).^2));
    hold on;
    grid on
    plot(10*log10(abs(x).^2),10*log10(abs(yRapp).^2),'.');
    xlabel('Input Power (dBW)');
    ylabel('Output Power (dBW)');
    title('Nonlinearity Impairment')
    legend('Linear characteristic', 'Modified Rapp nonlinearity','Location','Northwest');
end

function [sampleRate] = getNominalSampleRate(cfgObj)
    % Obtain nominal sample rate for the input parameter CFGOBJ. CFGOBJ is
    % an object of type 'nrDLCarrierConfig'
    sampleRate = nr5g.internal.wavegen.maxSampleRate(cfgObj);
end