5G NR Synchronization Signal Capture Using Software-Defined Radio
This example shows how to use a software-defined radio (SDR) to capture a synchronization signal burst (SS burst). The example then analyzes the capture and attempts to identify the strongest synchronization signal block (SSB). Additionally, you can save the capture to a MAT-file for further analysis with the NR Cell Search and MIB and SIB1 Recovery example.
Introduction

When user equipment (UE) performs initial synchronization procedures, it must scan over a set of predefined center frequencies searching for an SS burst. Once it detects an SSB, the UE identifies the cell ID and recovers the MIB and system information block type 1 (SIB1).
The frequencies that a UE searches over are determined by the global synchronization channel numbers (GSCNs) defined in Table 5.4.3.3-1 of TS 38.101-1 [1]. This example shows how to select a GSCN value for your operating band of interest and calculate the center frequency. After the example determines the center frequency, it sets up the SDR receiver to capture a waveform at the specified frequency. You can specify additional parameters for the SDR receiver, such as gain, capture bandwidth, and capture antennas. After the SDR receiver captures a waveform, the example attempts to determine the location of the strongest SSB in the waveform. If the waveform contains an SSB and you want to perform a full recovery of the MIB and SIB1, you can save the waveform to a MAT-file for further analysis with the NR Cell Search and MIB and SIB1 Recovery example.
Required Hardware and Software
This example uses SDRs supported by Wireless Testbench™ and Communication Toolbox™ support packages. This list provides information on which radios this example can use along with the required products.
300-Series USRP™ Radio or USRP X410 (requires Wireless Testbench™ and Wireless Testbench Support Package for NI™ USRP Radios). For more information, see Install Support Package for NI USRP Radios (Wireless Testbench) and Supported Radio Devices (Wireless Testbench).
ADALM-PLUTO (requires Communications Toolbox Support Package for Analog Devices® ADALM-PLUTO Radio). For more information, see ADALM-Pluto Radio.
USRP E310/E312 (requires Communications Toolbox Support Package for USRP™ Embedded Series Radio). For more information, see USRP Embedded Series Radio.
200-Series USRP Radio (requires Communications Toolbox Support Package for USRP Radio). For more information, see USRP Radio and Supported Hardware and Required Software.
Configure SDR Parameters
Set Up SDR Receiver Object
Specify the SDR's device name from the dropdown list along with the capture antenna configuration and radio gain.
If you are using an NI USRP hardware with Wireless Testbench, click Update to see your saved radio setup configuration name appear at the top of the dropdown list.
radioOptions = hSDRBase.getDeviceNameOptions;
rx = hSDRReceiver(radioOptions(1)) ;
antennaOptions = getAntennaOptions(rx);
rx.ChannelMapping = antennaOptions(1);
rx.Gain = 50;
Specify Capture Center Frequency
When deciding your capture center frequency, you have the option to specify either a GSCN value or a custom center frequency.
To determine a GSCN value, you must first determine the desired NR operating band that you want to capture. Use the table stored in the FR1DLOperatingBand property from the hSynchronizationRasterInfo class to inspect possible operating bands and their frequency ranges. Table 5.2-1 in TS 38.101-1 defines the table stored in the FR1DLOperatingBand property.
fr1BandInfo = hSynchronizationRasterInfo.FR1DLOperatingBand
fr1BandInfo=49×2 table
    2110    2170
    1930    1990
    1805    1880
     869     894
    2620    2690
     925     960
     729     746
     746     756
     758     768
     860     875
     791     821
    1525    1559
    1930    1995
     859     894
      ⋮
After you determine the band you would like to capture, specify it in the edit field below.
The example extracts a structure containing possible GSCN values, subcarrier spacing of the SS burst, and the block pattern of the SS burst. The information that is stored in the SynchronizationRasterFR1 property of the hSynchronizationRasterInfo class comes from Table 5.4.3.3-1 in TS 38.101-1.
syncRasterInfo = hSynchronizationRasterInfo.SynchronizationRasterFR1;
band = "n77";
bandRasterInfo = syncRasterInfo.(band)
"n77";
bandRasterInfo = syncRasterInfo.(band)bandRasterInfo = struct with fields:
SCS: 30
BlockPattern: 'C'
GSCN: [7711 7712 7713 7714 7715 7716 7717 7718 7719 7720 7721 7722 7723 7724 7725 7726 7727 7728 7729 7730 7731 7732 7733 7734 7735 7736 7737 7738 7739 7740 7741 7742 7743 7744 7745 7746 7747 7748 7749 7750 7751 7752 7753 … ] (1×619 double)
After selecting a GSCN value for the operating band of interest, specify the GSCN parameter in the edit field below.
If you prefer to use a custom center frequency, select useCustomCenterFrequency and enter your custom center frequency.
useCustomCenterFrequency =false; GSCN =
7791; if useCustomCenterFrequency rx.CenterFrequency =
3520e6; %#ok<*UNRCH> else rx.CenterFrequency = hSynchronizationRasterInfo.gscn2frequency(GSCN); end
Determine Subcarrier Spacing
Based on the center frequency, the example determines the possible subcarrier spacing options (15 kHz or 30 kHz) that pertain to the operating band that the center frequency lies in.
Click Update to see the possible subcarrier spacing options and select a subcarrier spacing. The example uses the subcarrier spacing to analyze the captured waveform.
scsOptions = hSynchronizationRasterInfo.getSCSOptions(rx.CenterFrequency); scs =scsOptions(1)
;
Determine Minimum Capture Sample Rate
Use the nrOFDMInfo function to calculate the optimal capture sample rate for an SSB. Alternatively, specify a custom sample rate.
nrbSSB = 20; % Number of resource blocks in an SSB scsNumeric = double(extract(scs,digitsPattern)); ofdmInfo = nrOFDMInfo(nrbSSB,scsNumeric); rx.SampleRate =ofdmInfo.SampleRate;
Initiate Waveform Capture
Use the framesPerCapture parameter to specify the minimum number of full frames to capture.
framesPerCapture = 2;
captureDuration = seconds((framesPerCapture+1)*10e-3);
2;
captureDuration = seconds((framesPerCapture+1)*10e-3);Begin the waveform acquisition.
waveform = capture(rx,captureDuration);
release(rx);
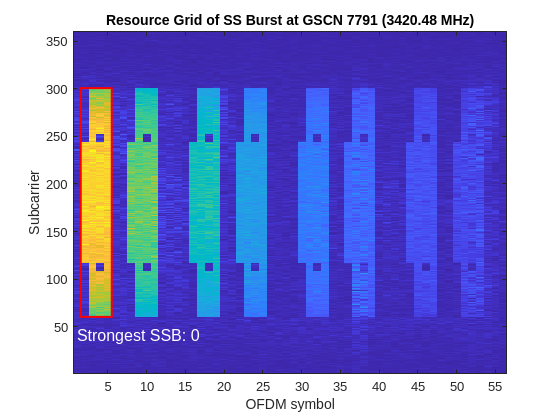
Locate Strongest SSB
Use the findSSB local function to identify if a valid SSB is present in the captured waveform.
detectedSSB = findSSB(waveform,rx.CenterFrequency,scs,rx.SampleRate);
Further Exploration
Save Waveform
If the example detected a valid SSB in the captured waveform, save the waveform to a MAT-file for a more in-depth analysis with the NR Cell Search and MIB and SIB1 Recovery example.
Specify a filename for the MAT-file. The example appends the GSCN value and the capture date to the filename when saving the waveform.
fileNamePrefix ="capturedWaveform"; if detectedSSB saveWaveform(rx,waveform,scs,fileNamePrefix) end
Scan Multiple GSCNs
Previously, the example captured only a single waveform and performed an initial analysis of it. The following code enables you to specify multiple GSCN values to scan over a set of center frequencies searching for valid SSBs. For each detected SSB, the example displays the SSB and saves the captured waveform to a MAT-file.
Specify a vector of GSCN values for the example to scan over. To determine valid GSCN values, see the Specify Capture Center Frequency section.
GSCNs =  [7884 7923 7981];
Set the number of frames for the SDR receiver to capture.
framesPerCapture =  2;
2;Use the scanGSCNs local function to initiate a search for valid SSBs at the specified GSCNs. The function requires an hSDRReceiver object as one of the inputs. If an SDR receiver is not already set up, see the Set Up SDR Receiver Object section.
scanGSCNs(rx,GSCNs,framesPerCapture,fileNamePrefix);
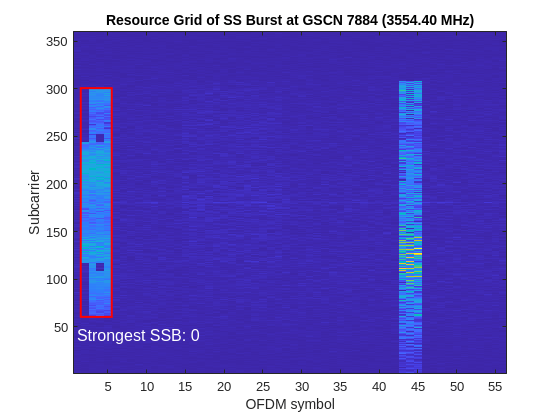
No SSB Detected at GSCN 7923 (3610.56 MHz).

References
3GPP TS 38.101-1. "NR; User Equipment (UE) radio transmission and reception; Part 1: Range 1 Standalone" 3rd Generation Partnership Project; Technical Specification Group Radio Access Network.
Local Functions
These functions assist in locating valid SSBs.
function scanGSCNs(rx,gscns,framesPerCapture,fileNamePrefix)
% SCANGSCNS uses the SDR receiver RX to capture a waveform at each GSCN in
% GSCNS. The functions analyzes each captured waveform for a valid SSB and
% subsequently saves the waveform to a MAT-file with the file name
% containing FILENAMEPREFIX. The duration of each captured waveform depends
% on FRAMESPERCAPTURE.
    captureDuration = seconds((framesPerCapture+1)*10e-3);

    for gscn = gscns

        % Set up center frequency and sample rate based on GSCN
        rx.CenterFrequency = hSynchronizationRasterInfo.gscn2frequency(gscn);
        scsOptions = hSynchronizationRasterInfo.getSCSOptions(rx.CenterFrequency);
        for scs = scsOptions
            scsNumeric = double(extract(scs,digitsPattern));
            nrbSSB = 20; % Number of resource blocks in an SSB
            ofdmInfo = nrOFDMInfo(nrbSSB,scsNumeric);

            % The receiver only captures a wide enough bandwidth to detect a
            % SSB. To find and decode the SIB1 the sample rate will need
            % increased.
            rx.SampleRate = ofdmInfo.SampleRate;

            % Capture waveform
            waveform = capture(rx,captureDuration);
            release(rx);

            % Search for a valid SSB
            detectedSSB = findSSB(waveform,rx.CenterFrequency,scs,rx.SampleRate);

            if detectedSSB
                saveWaveform(rx,waveform,scs,fileNamePrefix)
            end
        end
    end
end

function saveWaveform(rx,waveform,scs,fileNamePrefix)
% SAVEWAVEFORM saves the WAVEFORM and other parameters to a MAT-file with
% the name containing FILENAMEPREFIX.
    % Initialize parameters that are to be saved to the MAT-file
    sampleRate = rx.SampleRate;
    fPhaseComp = rx.CenterFrequency;
    minChannelBW = hSynchronizationRasterInfo.getMinimumBandwidth(scs,rx.CenterFrequency);
    ssbBlockPattern = hSynchronizationRasterInfo.getBlockPattern(scs,rx.CenterFrequency);

    % Determine the number of SSBs in the SS burst
    if fPhaseComp > 3e9
        L_max = 8;
    else
        L_max = 4;
    end

    % Append GSCN and capture date to user supplied file name and save file
    gscn = hSynchronizationRasterInfo.frequency2gscn(rx.CenterFrequency);
    fileName = fileNamePrefix+"_"+gscn+string(datetime('now',Format='_yyyy_MM_dd'))+".mat";
    save(fileName,"waveform","sampleRate","fPhaseComp","minChannelBW","ssbBlockPattern","L_max")
end
function detectedSSB = findSSB(waveform,centerFrequency,scs,sampleRate)
% FINDSSB returns a logical value that depends on if WAVEFORM contains a
% valid SSB.
    detectedSSB = false;
    ssbBlockPattern = hSynchronizationRasterInfo.getBlockPattern(scs,centerFrequency);
    scsNumeric = double(extract(scs,digitsPattern));
    searchBW = 3*scsNumeric;
    displayFigure = false;
    [correctedWaveform,~,NID2] = hSSBurstFrequencyCorrect(waveform,ssbBlockPattern,sampleRate,searchBW,displayFigure);

    gscn = hSynchronizationRasterInfo.frequency2gscn(centerFrequency);
    if NID2 == -1
        noSSBMessage(gscn,centerFrequency);
        return;
    end

    % Create a reference grid for timing estimation
    nrbSSB = 20;
    refGrid = zeros([nrbSSB*12 2]);
    refGrid(nrPSSIndices,2) = nrPSS(NID2);

    % Calculate timing offset and demodulate the grid
    nSlot = 0;
    timingOffset = nrTimingEstimate(correctedWaveform,nrbSSB,scsNumeric,nSlot,refGrid,SampleRate=sampleRate);
    correctedWaveform = correctedWaveform(1+timingOffset:end,:);
    rxGrid = nrOFDMDemodulate(correctedWaveform,nrbSSB,scsNumeric,nSlot,SampleRate=sampleRate);
    rxGrid = rxGrid(:,2:5,:);

    % Extract the received SSS symbols from the SS/PBCH block
    sssIndices = nrSSSIndices;
    sssRx = nrExtractResources(sssIndices,rxGrid);

    % Correlate received SSS symbols with each possible SSS sequence
    sssEst = zeros(1,336);
    for NID1 = 0:335
        ncellid = (3*NID1) + NID2;
        sssRef = nrSSS(ncellid);
        sssEst(NID1+1) = sum(abs(mean(sssRx .* conj(sssRef),1)).^2);
    end

    % Determine NID1 by finding the strongest correlation
    NID1 = find(sssEst==max(sssEst)) - 1;

    % Form overall cell identity from estimated NID1 and NID2
    ncellid = (3*NID1) + NID2;

    % Calculate PBCH DM-RS indices
    dmrsIndices = nrPBCHDMRSIndices(ncellid);

    % Perform channel estimation using DM-RS symbols for each possible
    % DM-RS sequence and estimate the SNR
    dmrsEst = zeros(1,8);
    for ibar_SSB = 0:7
        refGrid = zeros([240 4]);
        refGrid(dmrsIndices) = nrPBCHDMRS(ncellid,ibar_SSB);
        [hest,nest] = nrChannelEstimate(rxGrid,refGrid,'AveragingWindow',[0 1]);
        dmrsEst(ibar_SSB+1) = 10*log10(mean(abs(hest(:).^2)) / nest);
    end

    % Record ibar_SSB for the highest SNR
    ibar_SSB = find(dmrsEst==max(dmrsEst)) - 1;

    % Channel Estimation using PBCH DM-RS and SSS
    refGrid = zeros([nrbSSB*12 4]);
    refGrid(dmrsIndices) = nrPBCHDMRS(ncellid,ibar_SSB);
    refGrid(sssIndices) = nrSSS(ncellid);
    [hest,nest] = nrChannelEstimate(rxGrid,refGrid,'AveragingWindow',[0 1]);

    % Extract the received PBCH symbols from the SS/PBCH block
    [pbchIndices,pbchIndicesInfo] = nrPBCHIndices(ncellid);
    pbchRx = nrExtractResources(pbchIndices,rxGrid);

    % Configure 'v' for PBCH scrambling according to TS 38.211 Section
    % 7.3.3.1 'v' is also the 2 LSBs of the SS/PBCH block index for
    % L_max=4, or the 3 LSBs for L_max=8 or 64.
    if centerFrequency <= 3e9
        L_max = 4;
        v = mod(ibar_SSB,L_max);
    else
        L_max = 8;
        v = ibar_SSB;
    end
    ssbIndex = v;

    % PBCH equalization and CSI calculation
    pbchHest = nrExtractResources(pbchIndices,hest);
    [pbchEq,csi] = nrEqualizeMMSE(pbchRx,pbchHest,nest);
    Qm = pbchIndicesInfo.G / pbchIndicesInfo.Gd;
    csi = repmat(csi.',Qm,1);
    csi = reshape(csi,[],1);

    % PBCH demodulation
    pbchBits = nrPBCHDecode(pbchEq,ncellid,v,nest);

    % Apply CSI
    pbchBits = pbchBits .* csi;

    % Perform BCH decoding
    polarListLength = 8;
    [~,crcBCH] = nrBCHDecode(pbchBits,polarListLength,L_max,ncellid);

    if crcBCH == 0
        % Plot grid and highlight strongest SSB
        demodRB = 30;
        rxGrid = nrOFDMDemodulate(correctedWaveform,demodRB,scsNumeric,nSlot,SampleRate=sampleRate);
        % Extract 4 symbols of grid if exists
        if size(rxGrid,2) < 56
            last = size(rxGrid,2);
        else
            last = 14*4;
        end
        figure;imagesc(abs(rxGrid(:,1:last,1))); axis xy
        xlabel('OFDM symbol'); ylabel('Subcarrier');
        ttl = sprintf('Resource Grid of SS Burst at GSCN %d (%.2f MHz)',gscn,centerFrequency/1e6);
        title(ttl)
        ssbFreqOrigin = 12*(demodRB-nrbSSB)/2 + 1;
        startSymbol = 1;
        numSymbolsSSB = 4;
        rectangle('Position',[startSymbol+0.5 ssbFreqOrigin-0.5 numSymbolsSSB 12*nrbSSB],EdgeColor='r',LineWidth=1.5)
        str = sprintf('Strongest SSB: %d',ssbIndex);
        text(startSymbol,ssbFreqOrigin-nrbSSB,0,str,FontSize=12,Color='w');
        detectedSSB = true;
        drawnow
    else
        noSSBMessage(gscn,centerFrequency);
    end
end

function noSSBMessage(gscn,centerFrequency)
    fprintf("<strong>No SSB detected at GSCN %d (%.2f MHz).</strong>\n",gscn,centerFrequency/1e6);
end