Main Content

phased.TOAEstimator

Time-of-arrival estimation

Since R2024a

Description

The phased.TOAEstimator creates a time-of-arrival System object™ to estimate times-of-arrival (TOA) or time-differences of arrival (TDOA) of signals at known anchor points. The System object then uses time estimates to perform 2-D or 3-D target positioning of objects. Anchors can encompass receivers or transmitter such as cellular base stations, Wi-Fi® access points, ground radar stations, or sonobuoys with known positions and a target whose position is to be determined.

To estimate TOA or TDOA and estimate target positions:

  1. Create the phased.TOAEstimator object and set its properties.

  2. Call the object with arguments, as if it were a function.

To learn more about how System objects work, see What Are System Objects?

Creation

Description

example

estim = phased.TOAEstimator creates a TOA or TDOA estimator System object estim.

estim = phased.TOAEstimator(Name=Value) creates a TOA or TDOA estimator estim System object with each specified property Name set to the specified Value. You can specify additional name-value pair arguments in any order as (Name1=Value1,...,NameN=ValueN).

Properties

expand all

Unless otherwise indicated, properties are nontunable, which means you cannot change their values after calling the object. Objects lock when you call them, and the release function unlocks them.

If a property is tunable, you can change its value at any time.

For more information on changing property values, see System Design in MATLAB Using System Objects.

Signal propagation speed, specified as a real-valued positive scalar. Units are in m/s.

Example: PropagationSpeed=3e8

Data Types: single | double

Measurement model, specified as 'TOA' or 'TDOA'.

  • For 'TOA', the object estimates TOA using TOA spectrum analysis followed by a TOA positioning algorithm.

  • For 'TDOA', the object calculates TDOA measurements from TOA measurements and then applies a TDOA positioning algorithm.

Example: Measurement='TDOA'

Data Types: char | string

TOA spectrum analysis method, specified as 'FFT' or 'MUSIC'.

  • For 'FFT', an FFT algorithm is used to obtain the TOA spectrum.

  • For 'MUSIC', a MUSIC super-resolution algorithm is used to obtain the TOA spectrum.

Example: SpectrumMethod='MUSIC'

Data Types: char | string

Enable the input of known or estimated delay offsets between anchors and target, specified as false or true. When true, use the object input argument delayoffset to specify delay offsets. When false, the delayoffset input argument is not used and delay offsets are assumed to be 0.

Example: DelayOffsetInputPort=true

Data Types: logical

Enable the output of variances of the TOA or TDOA estimates using the var input argument, specified as false or true. Set this property to true to output the estimated variances. Set this property to false to not output the estimated variances.

Example: VarianceOutputPort=true

Data Types: logical

Enable output of the FFT-based TOA response argument toaresp, specified as false or true. Set this property to true to output the TOA response. Set this property to false to not output the TOA response.

Example: TOAResponseOutputPort=true

Dependencies

To enable this property, set the Measurement property to 'TOA' and set the SpectrumMethod property to 'FFT'.

Data Types: logical

Enable the output of the estimated target position tgtposest, specified as false or true. This property also enables the input of anchor positions using the anchorpos argument. Set this property to false to not allow input of anchor positions and suppress output of the target position.

Example: TargetPositionOutputPort=true

Data Types: logical

Source of noise power values used for TOA/TDOA variance estimation, specified as 'Property' or 'Input port'. When you set NoisePowerSource to 'Property', the NoisePower property represents the noise power of the received data. When you set the NoisePower property to 'Input port', you can specify the noise power using the npow input argument.

Example: NoisePowerSource='Input port'

Data Types: logical

Noise power for the received signal, specified as a positive scalar or a length-L real-valued nonnegative vector. If NoisePower is a scalar, the noise power is the same for all L anchors. If NoisePower is an L-dimensional vector, each noise power value is applied to one of the L anchors. Units are Watts.

Example: [0.5 0.7 0.8]

Dependencies

To enable this property, set the NoisePowerSource property to 'Property'.

Data Types: single | double

Enable forward-backward averaging, specified as false or true. Forward-backward averaging mitigates rank-deficiency in a source covariance matrix that is used in the MUSIC spectrum analysis estimation. Forward-backward averaging is useful when the number of independent samples of the channel estimate is small. Set this property to true to enable forward-backward averaging. Set this property to false to disable forward-backward averaging.

Dependencies

To enable this property, set the SpectrumMethod property to 'MUSIC'.

Data Types: logical

Effective reduction in the number of subbands for TOA estimation due to spatial smoothing, specified as a nonnegative integer. Spatial smoothing can be used to mitigate the rank-deficiency issue in the source covariance matrix estimation of the MUSIC spectrum analysis method. This technique is useful when the number of independent samples of a channel estimate is small.

If there are N subbands and the value of the SpatialSmoothing property is K, (K+1) maximally-overlapped bands of N-K subbands are formed. Then, (K+1) covariance matrices are estimated for signals on the (K+1) overlapped bands and these (K+1) covariance matrices are averaged together to produce a spatially smoothed covariance matrix of size (N-K)-by-(N-K).

Increasing K by 1 increases the rank of the spatially smoothed covariance matrix by 1 until the range reaches its maximum. However, the effective number of subbands for TOA estimation is reduced by 1. The minimum value of K is 0 which imp[lies in no spatial smoothing. The maximum value of K is N-2, resulting in (N-1) overlapped bands of two subbands.

If SpatialSmoothing is a scalar, the spatial smoothing is the same for all L anchors. If SpatialSmoothing is a length-L vector, each spatial smoothing value is applied to each of the L anchors.

Dependencies

To enable this property, set the SpectrumMethod property to 'MUSIC'.

Data Types: single | double

Usage

Description

example

Y = estim(X,freqspacing) estimates the time of arrival (TOA) or time difference of arrival (TDOA) of signals Y at anchors from the channel estimation matrix X. This syntax assumes that the anchors and the target are time-synchronized.

  • If the Measurement property is set to 'TOA', the object estimates the TOA between each anchor and the target.

  • If the Measurement property is set to 'TDOA', the object performs TOA estimation first and then uses the TOA measurements to calculate TDOA.

The freqspacing represents the channel frequency spacing.

Y = estim(X,freqspacing,delayoffset) performs TOA or TDOA estimation when the anchors and target are not time-synchronized. The TOA and TDOA estimation results Y are compensated by the delayoffset ar. To enable this syntax, set the DelayOffsetInputPort property to true.

[Y,var] = estim(X,freqspacing,delayoffset,...) outputs the measurement variances var. To enable this syntax, set the VarianceOutputPort property to true.

[Y,var] = estim(X,freqspacing,…,npow) calculates the output measurement variances var for input Gaussian white noise power npow.

[Y,...,toaresp,toagrid] = estim(X,freqspacing,...) outputs the FFT-based TOA response toaresp and the TOA grid toagrid. To enable this syntax, set the TOAResponseOutputPort property to true.

[Y,...,tgtposest,tgtposcov] = estim(X,freqspacing,...,anchorpos) outputs the estimated target position tgtposest and the estimated target position covariance tgtposcov. This syntax also accepts anchor positions anchorpos as input. To enable this syntax, set the TargetPositionOutputPort property to true.

Input Arguments

expand all

Frequency-domain channel estimation matrices, specified as an N-by-M-by-L array or a 1-by-L cell array.

  • When the channel estimation matrix is an N-by-M-by-L array, each page of the array is an N-by-M channel estimation matrix for the Lth anchor. All channel estimation matrices must be the same size.

  • When the channel estimation matrices is a 1-by-L cell array, each cell contains a frequency-domain channel estimation matrix from one of the L anchors. The size of a channel estimation matrix differ between anchors.

Each column of the channel estimation matrix represents a sample of a channel estimate of N uniformly-spaced subbands. The total bandwidth is freqspacing times N. Each row of the channel estimation matrix represents M samples of a channel estimate of one subband.

Frequency spacings of channel estimates, specified as a positive scalar or as a 1-by-L vector of positive values. If freqspacing is a scalar, the frequency spacing is the same for all L anchors. If freqspacing is a 1-by-L vector, the frequency spacing can be different for different anchors. Units are in Hz.

Example: [10e6 15e6 20e6]

Data Types: single | double

Known delay offset between the target and anchors, specified as a scalar or a real-valued 1-by-L vector. If delayoffset is a scalar, the delay offset is the same for all signals from or to all L anchors. If delayoffset is a 1-by-L vector, the delay offset can be different for different anchors. delayoffset compensates all TOA and TDOA estimation results Y. Units are in seconds.

Example: [0.5;-0.25;.1]

Dependencies

To enable this argument, set the DelayOffsetInputPort property to true.

Data Types: single | double

Gaussian white noise power, specified as a scalar or a positive real-valued 1-by-L vector. If npow is a scalar, the noise power is the same for all L anchors. If npow is a 1-by-L vector, a different noise power value is applied to each of the L anchors. npow used to calculate the output argument var. Units are in watts.

Example: 0.4

Dependencies

To enable this argument, set the NoisePowerSource property to 'Input port'.

Data Types: single | double

Anchor positions, specified as a Q-by-L real-valued matrix representing the position of the L anchors in the Q-dimensional Cartesian space (Q can be 2 or 3). Each column contains the position of each anchor in the two-dimensional Cartesian space or three-dimensional Cartesian space.

Dependencies

To enable this argument, set the TargetPositionOutputPort property to true.

Data Types: single | double

Output Arguments

expand all

Times-of-arrival (TOA) or time-differences of arrival (TDOA) estimation from a target at L anchors, returned as a 1-by-L real-valued vector or a 1-by-(L-1) real-valued vector.

  • If the Measurement property is 'TOA', Y is a 1-by-L real-valued vector. The signal model of the TOA output at the lth-anchor can be written as Y(l) = min(taul), for l = 1,2,...,L, where taul is the vector of received multipath delays at the lth anchor.

  • If the Measurement property is 'TDOA', Y is a 1-by-(L-1) real-valued vector. The signal model of the TDOA output at the (l-1)th anchor can be written as Y(l-1) = min(taul)-min(reftau), l = 2,3,...,L, where taul is the vector of received multipath delays at the lth anchor and reftau is the vector of received multipath delays at the first anchor.

Units are in seconds.

Data Types: single | double

  • If the Measurement is 'TOA', var is a 1-by-L positive real-valued vector representing the estimated TOA variance.

  • If the Measurement property is 'TDOA', var is a 1-by-(L-1) positive real-valeud vector representing the estimated TDOA variance.

Units are in seconds-squared. var is obtained through the Cramer-Rao lower bound (CRLB) of the TOA or TDOA estimator.

Dependencies

To enable this argument, set the VarianceOutputPort property to true.

Data Types: single | double

If the channel estimate X is an N-by-M-by-L array, the TOA response toaresp is a P-by-M-by-L array.

If the channel estimate X is a 1-by-L cell array, the TOA response toaresp is a 1-by-L cell array, containing the TOA response for each of the L anchors.

Dependencies

To enable this argument, set the TOAResponseOutputPort property to true.

Data Types: single | double
Complex Number Support: Yes

Times of arrival grid, returned as P-by-L matrix or a 1-by-L cell array. Times of arrival are restricted to this grid.

  • If the channel estimate X is a N-by-M-by-L array, toagrid is returned as a P-by-L matrix, where P is the number of TOA grid samples.

  • If the channel estimate X is a 1-by-L cell array, toagrid is a 1-by-L cell array, containing the TOA grid for each of the L anchors. Units are in seconds.

Dependencies

To enable this argument, set the TOAResponseOutputPort property to true.

Data Types: single

Estimated target positions, returned as a Q-by-1 vector representing the estimated target position obtained from TOA and TDOA measurements. Units are in meters.

Dependencies

To enable this argument, set the TargetPositionOutputPort property to true.

Data Types: single | double

Target position covariance estimates, returned as a Q-by-Q real positive semi-definite symmetric matrix. The matrix represents the estimated target position covariance using TOA and TDOA measurements. Units are m2.

Dependencies

To enable this argument, set the TargetPositionOutputPort property to true.

Data Types: single | double

Object Functions

To use an object function, specify the System object as the first input argument. For example, to release system resources of a System object named obj, use this syntax:

release(obj)

expand all

plotTOASpectrumEstimate and plot signal time-of-arrival (TOA) spectrum
stepRun System object algorithm
releaseRelease resources and allow changes to System object property values and input characteristics
resetReset internal states of System object

Examples

collapse all

Use received signals from five anchors with known positions to perform FFT-based TOA estimation. Obtain TDOA measurements followed by two-step WLLS-based TDOA positioning. The data is loaded from the TOAEstimatorExampleData file whose variables are here:

  • toa Anchor TOAs

  • N Number of sub-bands

  • M Number of channel samples

  • freqspacing Frequency spacing

  • npow Noise power

  • anchorpos Anchor positions

  • tgtpos Actual target position

First, load data from file.

load TOAEstimatorExampleData;

Create an exponential signal in a noise-free frequency-domain channel.

expsignal = exp(-1j*2*pi*(1:N)'*freqspacing*toa);

Create frequency-domain channel estimate.

X = cell(1,L);
for l = 1:L
    X{l} = expsignal(:,l)*ones(1,M) + ...
        sqrt(npow/2)*(randn(N,M)+1j*randn(N,M));
end

Configure a TDOA estimator to perform FFT-based spectrum analysis.

tdoaEstimator = phased.TOAEstimator('Measurement','TDOA',...
    'SpectrumMethod','FFT','NoisePower',npow,...
    'VarianceOutputPort',true,'TargetPositionOutputPort',true);

Estimate TDOA from the estimated TOA.

[tdoaest,tdoavar,tgtposest] = tdoaEstimator(X,freqspacing,anchorpos);

Find the rms target position estimate.

rmsetgtpos = rmse(tgtposest,tgtpos);
disp(['RMS TDOA positioning error = ',num2str(rmsetgtpos),' meters.'])
RMS TDOA positioning error = 0.10661 meters.

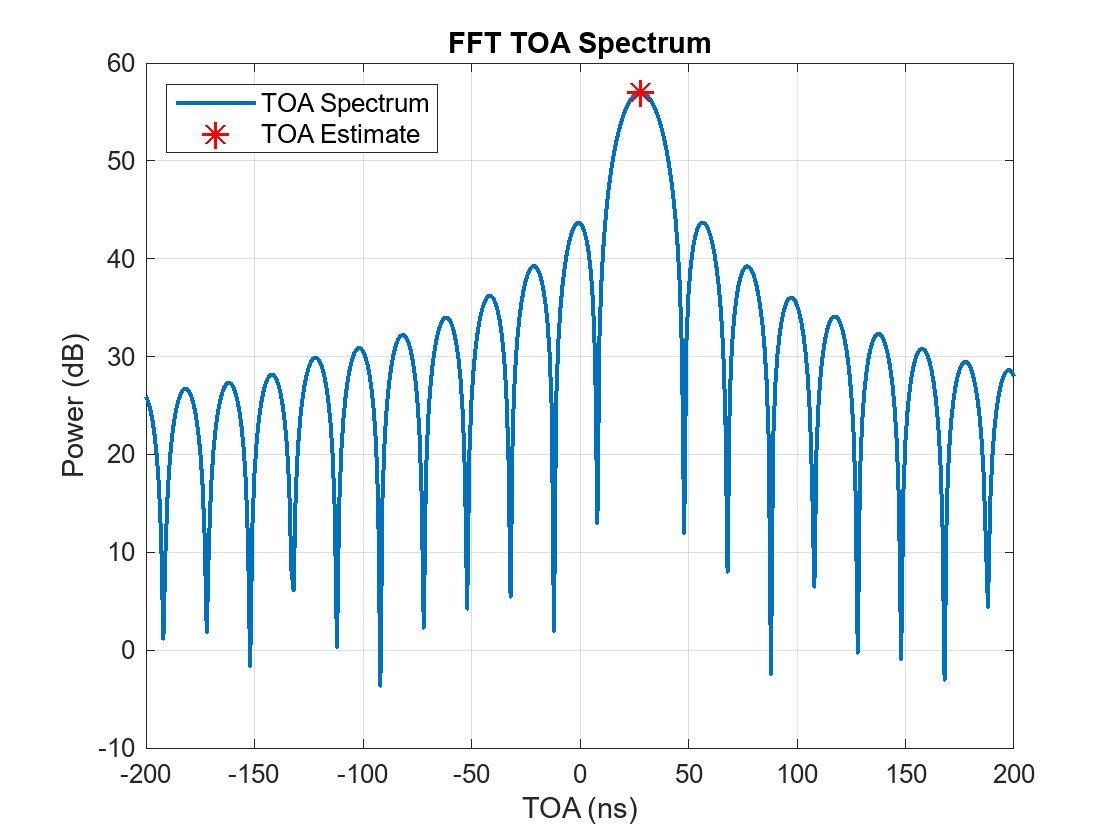
Plot the TOA spectrum.

[toaGrid,toaSpectrum,toaEst] = plotTOASpectrum( ...
    tdoaEstimator,freqspacing,'AnchorIndex',1, ...
    'MaxDelay',200e-9);

Figure contains an axes object. The axes object with title FFT TOA Spectrum, xlabel TOA (ns), ylabel Power (dB) contains 2 objects of type line. One or more of the lines displays its values using only markers These objects represent TOA Spectrum, TOA Estimate.

Perform MUSIC-based TOA estimation to obtain position estimates using received signals from five anchors with known positions. The data is loaded from the TOAEstimatorExampleData file whose variables are listed here:

  • toa Anchor TOAs

  • N Number of sub-bands

  • M Number of channel samples

  • freqspacing Frequency spacing

  • npow Noise power

  • anchorpos Anchor positions

  • tgtpos Actual target position

Load signal data.

load TOAEstimatorExampleData; 

Create the noise-free exponential signal models for all channels.

expsignal = exp(-1j*2*pi*(1:N)'*(freqspacing*toa));

Add Gaussian white noise.

  X = cell(1,L);
  for l = 1:L
      X{l} = expsignal(:,l)*ones(1,M) + ...
          sqrt(npow/2)*(randn(N,M)+1j*randn(N,M));
  end

Configure TOA estimator for MUSIC-based spectrum analysis.

toaEstimator = phased.TOAEstimator('Measurement','TOA', ...
'SpectrumMethod','MUSIC','VarianceOutputPort',true, ...
'NoisePower',npow,'ForwardBackwardAveraging',true, ...
'SpatialSmoothing',ceil(N/2));
 

Perform TOA estimation.

[toaest,toavar] = toaEstimator(X,freqspacing);

Perform TOA-based position estimation.

[tgtposest,tgtposcov] = toaposest(toaest,toavar,anchorpos);

Compute the RMSE target position estimate.

rmsepos = rmse(tgtposest,tgtpos);
disp(['RMS TOA positioning error = ', num2str(rmsepos), ' meters.'])
RMS TOA positioning error = 0.10669 meters.

Algorithms

expand all

References

[1] Reza Zekavat and R. Michael Buehrer, Handbook of Position Location: Theory, Practice, and Advances, 2019

[2] Andreas F. Molisch. Wireless Communications: From Fundamentals to Beyond 5G, 3rd Edition, 2023

[3] Y. T. Chan and K. C. Ho, "A simple and efficient estimator for hyperbolic location," in IEEE Transactions on Signal Processing, vol. 42, no. 8, pp. 1905-1915, Aug. 1994

[4] P. Stoica and A. Nehorai, "MUSIC, maximum likelihood, and Cramer-Rao bound," in IEEE Transactions on Acoustics, Speech, and Signal Processing, vol. 37, no. 5, pp. 720-741, May 1989

Version History

Introduced in R2024a