

MEX source to acccess popen r/w
A function for multi-objective optimization using evolutionary algorithms
This repository contains a Japanese version of a published repository "Electrophysiology tutorial for neuroscience" by Shubo Chakrabarti htt
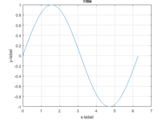
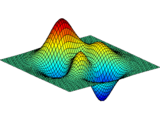
An introductory demonstration of the discrete Fourier transform, making use of the fft function.

You can learn how to detect and localize anomalies on image using Convolutional Auto Encoder.
Base commands to control Word in Matlab
The Model Debugger for SimBiology lets you analyze model responses, model structure, and expressions during simulations.

Please click the thumbnail to watch the GIF file. 概要はサムネイルをクリックして下さい.This demo shows how to continuously create a class activation mapping.
How to generate an animated GIF from MATLAB
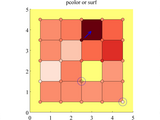
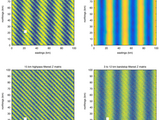
A brief explanation of the half-pixel offset in pcolor and surf.
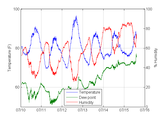
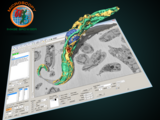
Analyzing Weather Data from an Arduino-based weather station
Version 1.4.2
MathWorks Internet of Things TeamAnalyze data from a weather station connected to ThingSpeak
Save Matlab figure(s) to a PowerPoint Slide
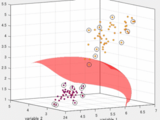
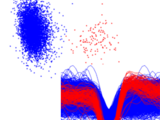
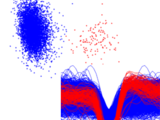
A hyper-plane in SVM classifier was visualized. 3変数にてSVMを使い、分類を行うときの分離曲面を可視化します。
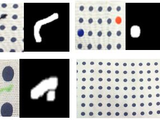
You can learn how to detect and localize anomalies on image using Variational Autoencoder
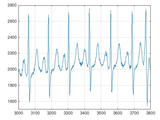
Visualization and analysis of an Electrocardiogram Signal
Version 1.0.0
Constantino Carlos Reyes-AldasoroLive Script shows how to find data peaks from EKG, how to refine peaks from data, and infer heart rate from peaks of Electrocardiogram data
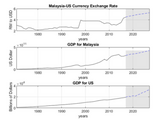
Models VAR using GDP for Malaysia, GDP for U.S. and Malaysia/U.S. Foreign Exchange Rate
Digital Processing of Electromyographic Signals for Control
Version 1.0.0
David Leonardo Rodriguez SarmientoLive Script shows complex calculations of digital signal processing (DSP) perform to infer info from biological signals acquired by sensors
This is an example showing how to use Lucas-Kanade method to show optical flow field
This is a tutorial for key data analysis steps used by neuroscientists - filtering, spike extraction, PCA, clustering, and spectral analysis
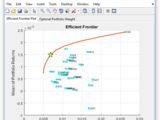
Getting Started with Portfolio Optimization (Files for Video Demo)
Version 1.2.0.0
MathWorks Quant TeamFiles for demonstrating how to perform portfolio optimization
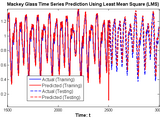
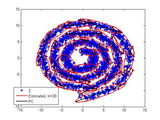
Mackey Glass Time Series Prediction Using Least Mean Square (LMS)
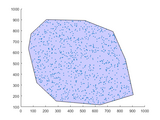
Create random point inside a polygone
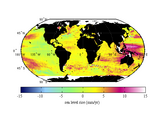
A simple example of how to create a map of sea level rise using publicly-available data.
Bifurcation diagrams for continuous-time dynamical systems based on analysis of local maxima and minima
Step-by-step tutorial of singular spectrum analysis (SSA)
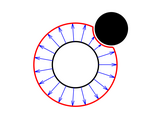

Lift table with hydraulic actuation, controlled by an analog circuit, with a 3-D scissor mechanism.
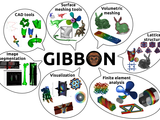
GIBBON: The Geometry and Image-Based Bioengineering add-ON for MATLAB

Evaluate a simple sigmoid function.

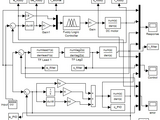
A DMC Simulink block with a demonstration example based the MATLAB demo, heatex

Redraws any curved art with animation using the Fourier transform.
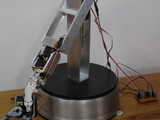
Simulation of Control Systems for a Mobile Robot Platform
Version 1.0.0.0
Dr. Redmond Ramin ShamshiriControl design for Field Survey Mobile Robot using lead-lag compensation, PID and Fuzzy Logic
Simply calculate distance traveled along a lat/lon path
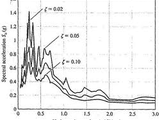
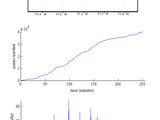
Dynamic response spectrum analysis, elastic and elastoplastic response spectra

Displays Methods and Functions of an m-file in a Tree View Control in the Notepad++ IDE
Interpolate over small gaps in x, but not over large gaps in x.
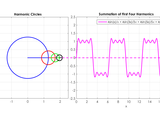
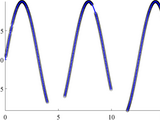
Animation showing square wave synthesis using harmonics
v2struct packs and unpacks variables to and from structures with enhanced functionality.
Easily perform 2D highpass, lowpass, bandpass, or bandstop filters on gridded datasets.
MIB is a package for segmentation of multi-dimensional (2D-4D) microscopy datasets

Generate surface plot of the Airy pattern
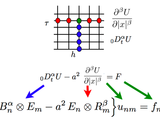
Matrix approach to discretization of ODEs and PDEs of arbitrary real order
Version 1.13.0.0
Igor PodlubnyFunctions illustrating matrix approach to discretization of ODEs / PDEs with fractional derivatives.

Calculate monthly means, annual medians, and other statistics for 1D or 3D datasets.

finding PSNR MSE R RMSE NRMSE MAPE

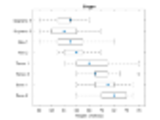
Simple GUI to fit 6 different first order flotation kinetics equation types to experimental data.
Function to smooth call option prices and implied volatilities free of static arbitrage.

MATLAB files from the webinar
Graphical and numerical functions for data analysis
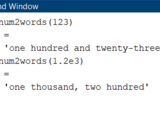
Convert a numeric to a string with the English name of the number value (GB/IN/US).

Files from the webinar can be viewed at http://optinum.co.za/_webinar/BloombergEMSXandMATLAB.mp4
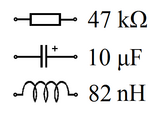
Round numeric array values to IEC 60063 resistor/capacitor values (E-Series of preferred numbers).
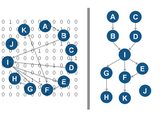
Compute/manipulate directed graph while retaining vertex labels

Geolocate data points from ocean color bin indices.
FSMEM can estimate MVGM parameters and number of conpounds via split/merge cluster moves

Distance from a point to a plane, and the projected point coordinates on the plane. Also works for array of points.
MATLAB library for elastic functional data analysis
An extension of inpaint_nans to 3 dimensions
You can also select a web site from the following list
Americas
- América Latina (Español)
- Canada (English)
- United States (English)
Europe
- Belgium (English)
- Denmark (English)
- Deutschland (Deutsch)
- España (Español)
- Finland (English)
- France (Français)
- Ireland (English)
- Italia (Italiano)
- Luxembourg (English)
- Netherlands (English)
- Norway (English)
- Österreich (Deutsch)
- Portugal (English)
- Sweden (English)
- Switzerland
- United Kingdom (English)
Asia Pacific
- Australia (English)
- India (English)
- New Zealand (English)
- 中国
- 日本Japanese (日本語)
- 한국Korean (한국어)