25 results
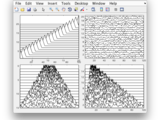
Stacked line plots from a matrix or vectors

Return sound pressure levels of pure tone frequencies at specified loudness level(s).
NOTE: this function is now available from the IoSR Matlab Toolbox as iosr.auditory.iso226. ------------------------- ISO 226:2003 Normal equal-loudness-level contours [spl,f] = iso226

Quantile-quantile plot with patch option
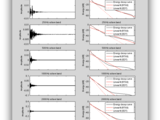
Calculate RT, DRR, Cte, and EDT for impulse response file

Apply a near-ideal low- or band-pass filter.
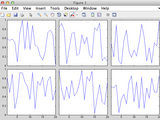
Calculate subplot positions by specifying figure margins and axis scaling.
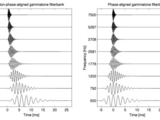
Produce an array of responses from a fourth-order Gammatone filter via FFT

Produces a colour colormap, of arbitrary length, that is monochrome-compatible.
Find local peaks or troughs in a vector

Draw a box plot with various display options
Quantiles of a sample via various methods

Calculate the long-term average spectrum of a signal
Perform windowed smoothing on a vector using mathematical functions

Apply 1/NOCT-octave smoothing to a magnitude spectrum.

Generates a psychoacoustic equal loudness contour (curve) as described in ISO 226.
amplitude returned for each of the 29 frequencies evaluated by ISO226. FREQ is the returned vector of frequencies that ISO226 evaluates to generate the contour.------------------------------------------------------------
Get the contents of a specified directory

Create a Contents.m file including subdirectories

Calculate loudness weighting coefficients based on ISO 226
NOTE: this function is now available from the IoSR Matlab Toolbox as iosr.auditory.loudWeight. ------------------------- Calculate loudness weighting coefficients based on ISO 226 g = loud_weight(f
Calculate cross-correlograms with a wide range of options
Check if mex file is compiled for the OS or if the source was modified since it was compiled.
Calculates Loudness Level according to ISO-226:2003 using Artificial Neural Networks for any SPL.
"0 fon" in the file “RedLoud.mat”. This prevents the function to take values outside its validity range as indicated in IS0-226: 2003. For example, to calculate the SPL of the curve "0 fon" use

STFT and ISTFT fulfilling constant overlap-add criterion

Calculate ideal time-frequency masks and apply time-frequency masks to signals via STFT

Perceptually-informed spectral centroid.
non-singleton dimension} | integer Specify the dimension over which to calculate the perceptual spectral centroid. 'loudness' : {'none'} | 'A' | 'B' | 'C' | 'D' | 'ISO-226' Specifies whether

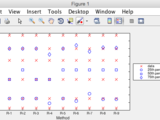
Draw a functional plot showing data spread
You can also select a web site from the following list
Americas
- América Latina (Español)
- Canada (English)
- United States (English)
Europe
- Belgium (English)
- Denmark (English)
- Deutschland (Deutsch)
- España (Español)
- Finland (English)
- France (Français)
- Ireland (English)
- Italia (Italiano)
- Luxembourg (English)
- Netherlands (English)
- Norway (English)
- Österreich (Deutsch)
- Portugal (English)
- Sweden (English)
- Switzerland
- United Kingdom (English)
Asia Pacific
- Australia (English)
- India (English)
- New Zealand (English)
- 中国
- 日本Japanese (日本語)
- 한국Korean (한국어)