
Extract data from line plots in a MATLAB Figure
This function will extract data from the given axes of the Matlab figure.
This function used to extract (x,y) data from the matlab figure.It will work with multiple lines also.syntaxx = -pi:pi/25:pi;y = sin(x);plot(x,y,'-k'); hold on[x,y] = myfigextract(gca);indices =
- 12 (All time)
- 1 (Last 30 days)
- -- / 5
- Community
-
23 Sep 2023

Extract data points from any plot
Digitize_Plotted_DataExtract data points from a plotInstructions:Run the script and select an image of the plotEnter the values of the x and y boundaries of the dataSpecify if the x and y axes are
- 37 (All time)
- 2 (Last 30 days)
- -- / 5
- Community
-
16 Apr 2022
Extracts data from the lines in a .fig figure file. Version 1.2.
More than once, I have found an old .fig file, but I can't find the data set that was used to create it. getfigdata.m will examine a figure and return the data for all of the lines in a figure.
- 2.7K (All time)
- 4 (Last 30 days)
- 5.0 / 5
- Community
-
29 Apr 2024
Extract X and Y data points from a plot
Open the figure, run the script, and get back your plotted data points.
Often times, you would have plotted some data and deleted them, but would have saved your figure file. How do you get back the data points from the figure? Open the figure, run this script, and you
- 164 (All time)
- 1 (Last 30 days)
- 5.0 / 5
- Community
-
1 Feb 2016
Extracts data points as a vector from a scanned plot (*.tif)
Extracts data points as a vector from a scanned plot (*.tif).
This program extracts the data points from a plot that is scanned from any paper or a journal article. This is very helpful for people who wants to extract the data and over plot with their data.
- 1.7K (All time)
- 1 (Last 30 days)
- 2.3 / 5
- Community
-
5 Jan 2005

Digitizes images and extracts data from plots
DigiGraph is a digitizer. DigiGraph makes it easy to digitize entire plots. It is designed to extract line plots. However, it is possible to extract fine detail from a digital (or scanned) photograph
- 2.7K (All time)
- 1 (Last 30 days)
- 2.0 / 5
- Community
-
15 Jan 2007
Extract contour data from contour matrix C
Extract contour data created by CONTOUR, CONTOURF, CONTOUR3, and CONTOURC.
CONTOURDATA Extract Contour Data from Contour Matrix C.CONTOUR, CONTOURF, CONTOUR3, and CONTOURC all produce a contour matrixC that is traditionally used by CLABEL for creating contour labels.S =
- 3.1K (All time)
- 4 (Last 30 days)
- 5.0 / 5
- Community
-
31 Oct 2012

Making Surface Plots From Scatter Data
How to turn a collection of XYZ triplets into a surface plot.
How do you turn a collection of XYZ triplets into a surface plot? This is the most frequently asked 3D plotting question that I got when I was in Tech Support. This submission explains how.
- 38.6K (All time)
- 5 (Last 30 days)
- 4.6 / 5
- Community
-
1 Sep 2016
Extract data from a matlab figure (.fig) file
To extract data from a matlab figure (.fig) files generate using version 7 or later.
To extract data from a matlab figure (.fig) files generate using version 7 or later. It can be used for both 2D and 3D plots
- 2.2K (All time)
- 3 (Last 30 days)
- 4.5 / 5
- Community
-
19 Jan 2012

Collect and plot data from a TCPIP server in real time
Obtain real time data from a TCPIP object using Instrument Control Toolbox and visualize it live.
This example demonstrates how to automatically read a set number of data bytes as and when they are available. This MATLAB® script also generates a real time plot of streaming data collected from the
- 12.2K (All time)
- 3 (Last 30 days)
- 5.0 / 5
- Community
-
1 Sep 2016

Digitize chart data from an image.
Digitizer extracts data points from an image file. Plots in X/Y and Polar can be digitized.Demonstration of usage can be found at: https://youtu.be/zNYWioXi98wDigitizer is an app where you load an
- 2.1K (All time)
- 113 (Last 30 days)
- 5.0 / 5
- Community
-
6 Nov 2025

Boundary extraction (identification and tracing) from point cloud data
For any input point set the algorithms are able to not only identify boundary edges, but also trace.
The algorithms can:1) extract (identify and trace) both outer and inner boundaries separately from the input point set,2) work on any type of input point sets,3) extract boundaries separately from
- 1.5K (All time)
- 1 (Last 30 days)
- 5.0 / 5
- Community
-
12 Dec 2016

GUI utility to extract x, y data series from MATLAB figures
Extract x and y data series from a MATLAB figure to a Microsoft Excel file.
the figure may have different x ranges. This utility can be easily expanded to extract x, y, and z data series from a 3-D figure. MATLAB R14 or higher is needed. This utility is compiler ready.
- 2.4K (All time)
- 1 (Last 30 days)
- 4.6 / 5
- Community
-
19 May 2009

surfir - Surface plot from irregular data points
surfir takes vectors of data points x,y,z and creates a surface plot - similar to surf but for irregularly spaced data.
even be non-convex. You want to visualize the function as one of those nice surface plots. 'surf', however, requires the data to come in the form of a mesh grid, which is not easy to obtain if you don't
- 1.1K (All time)
- 2 (Last 30 days)
- 5.0 / 5
- Community
-
16 Mar 2020

getDataTips - Get data tip text and handles
Extract data tip text and handles.
getDataTips() - prints content of all existing data tips in the current figure to the command window.getDataTips(h) - specify an array of figure or axis handles. content = getDataTips(__) - stores
- 544 (All time)
- 2 (Last 30 days)
- 5.0 / 5
- Community
-
29 Oct 2020
ashape: a pedestrian alpha shape extractor
extracts 2d alpha shapes from a set of x/y data points
ASHAPE is a simple wrapper for ASLIB, which implements several (optimized) subroutines to extract and display 2d alpha shapes and alpha patches from a set of x/y data pointsASLIB returns a structure
- 21.5K (All time)
- 2 (Last 30 days)
- 5.0 / 5
- Community
-
13 Apr 2010

Extract text from a PDF document
(if you are lucky)
The submission calls on PDFTextStripper class of Ben Litchfield's PDFBox Java library to extract text from a PDF document.1. Download PDFBox library from http://sourceforge.net/projects/pdfbox/2
- 9K (All time)
- 2 (Last 30 days)
- 4.1 / 5
- Community
-
4 Apr 2016

Extract data from contour isolines
The script show how identify the x,y coordinates of a specific isoline of a contour plot and the calculation of the respective areas.
The script show how identify the x,y coordinates of a specific isoline of a contour plot and the calculation of the respective areas.
- 155 (All time)
- 1 (Last 30 days)
- -- / 5
- Community
-
5 Apr 2019
plot spread points (beeswarm plot)
plotSpread plots distributions of data points, adding jitter to the points to avoid overlap.
plotSpread allows creating "beeswarm plots", i.e. point distributions where jitter has been added to the data points to avoid overlap.It further allows specifying groups within the data to show the
- 12.8K (All time)
- 13 (Last 30 days)
- 4.9 / 5
- Community
-
11 Feb 2017

Contour Plot for Scattered Data
Triangular Contour Plot
TRI, such as that returned by DELAUNAY. Each row of TRI contains indices into the X,Y, and Z vertex vectors to define a single triangular face. Contours are computed directly from the triangulation
- 7.1K (All time)
- 6 (Last 30 days)
- 4.7 / 5
- Community
-
31 Oct 2012

Plot The Data From Simulink Scope
Easily plot the data from scope and add title , xlable and so on with a single statement.
You can easy plot the data from simulink scope with title , xlable and so on by this function.For example, D0(ScpoeData,'r') will draw a red line in figure whose data is from scopedata you saved. And
- 2.3K (All time)
- 2 (Last 30 days)
- 5.0 / 5
- Community
-
17 Dec 2008
This function extracts multiple data plot values from figure files in Matlab.
%%% % Input : File name % with multiple plots in a single file% Output : struct data% : data.names contains names of the display object Yvalues% : data.Y contains the
- 588 (All time)
- 2 (Last 30 days)
- 1.0 / 5
- Community
-
6 Nov 2019

Extract (pick out) data points off image files.
GRABIT Extracts data points from an image file.GRABIT starts a GUI program for extracting data from an image file. It is capable of reading in BMP, JPG, TIF, GIF, and PNG files (anything that is
- 108.8K (All time)
- 183 (Last 30 days)
- 4.8 / 5
- Community
-
1 Sep 2016
DataTheif Helps you to extract data points from graphs.
You can scan a graph from a printed publication and load it using DataTheif, and then extract data points from it.
- 3.2K (All time)
- 10 (Last 30 days)
- 4.8 / 5
- Community
-
7 Jun 2018
Extract image files from GIF
This script stract image files in your desired format from gif. You must indicate the name of your GIF and the name of your output images.nombre = strcat('name', num,'.jpg');name1.jpgname2.jpg
- 263 (All time)
- 1 (Last 30 days)
- 5.0 / 5
- Community
-
20 May 2017
Extract 2D images from 3D volume image data
This m-script slices 3D image file in MovingMask.raw in 2D images.
- 558 (All time)
- 1 (Last 30 days)
- 5.0 / 5
- Community
-
28 Mar 2012

ExtractSlice extracts an arbitrary slice, both intensities and indices, from a given volume.
ExtractSlice extracts an arbitrary slice, both intensities and indices, from the input volume given the center and normal of the slice. If you are familiar with IDL, this is the equivalent function
- 2K (All time)
- 1 (Last 30 days)
- 4.5 / 5
- Community
-
12 Aug 2011

Hydraulic Valve Parameters From Data Sheets and Experimental Data
Models and white paper on obtaining realistic parameter values from data sheets and measured data.
examples. Please read the README.txt file to get started.For an explanation of valve modeling and several of the examples contained in this submission, please watch, “Hydraulic Valve Parameters From Data
- 3.9K (All time)
- 4 (Last 30 days)
- 5.0 / 5
- Community
-
1 Sep 2016

- 2.4K (All time)
- 3 (Last 30 days)
- 4.8 / 5
- Community
-
22 Apr 2015

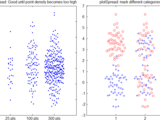
Plots data density of a two-dimensional distribution for human viewing.
Data density can be hard to read from scatter plots due to overstriking. I therefore calculate data density at each pixel as the reciprocal of the sum of squared distance from each point, adding a
- 6.9K (All time)
- 2 (Last 30 days)
- 4.1 / 5
- Community
-
29 Nov 2014
This function creates smooth patches of polar data in "bullseye" plot.
BULLSEYE plots patch data in polar coordinates. The DATA matrix is mapped to a bullseye plot as follows. The matrix rows are mapped to the circumference and matrix columns are mapped to radial
- 3K (All time)
- 3 (Last 30 days)
- 5.0 / 5
- Community
-
31 Mar 2016

Collect and plot data from an instrument in real time
Real time data collection & plotting using query based instrument interactions.
This MATLAB(R) script generates a real time plot of voltage values collected from an Agilent(TM) 34401A Digital Multimeter over the serial port(RS232). The data is collected and plotted until the
- 20.1K (All time)
- 1 (Last 30 days)
- 3.5 / 5
- Community
-
1 Sep 2016

Directly Extract Part Of Speech (POS) Information from MeCab
The functions in this repository enable to extract direct output of MeCab tokenizer. 形態素解析器MeCabの品詞分類を直接読み出すためのラッパー関数です.
`tokenizedDocument` and `tokenDetails` that enable to extract direct output of MeCab tokenizer.The Japanese tokenizers (MeCab) used in MATLAB Text Analytics Toolbox consolidates POS output (69 kinds) from the MeCab
- 78 (All time)
- 4 (Last 30 days)
- 5.0 / 5
- Community
-
7 Jul 2020
Extract values from a deeply nested Struct for a designated fieldname
Useful tool for searching and collecting values in a tree data type STRUCT with specific fieldname
STRUCTVAL is a convenient tool that extracts values from a deeply nested Struct for a designated fieldname. Assuming you have a data set that is constructed with the same property and stored in a
- 366 (All time)
- 1 (Last 30 days)
- 5.0 / 5
- Community
-
12 Jun 2017

3D Surface Plots from Excel Data GUI
Upload data from Excel and plot in 3D as a scatter plot, lsq curve fit, contour plot and others.
Allows users to import data from excel and easily create 3D graphs in Matlab. Capable of exporting and importing Z axis matrices, exporting pictures of the graphs, automatic labeling of the surfaces
- 6.5K (All time)
- 1 (Last 30 days)
- 4.3 / 5
- Community
-
16 Sep 2011

Download Daily Data from Google and Yahoo! Finance
Provides functions for getting data from both data sources as well as helper utility functions
This archive contains functions for downloading daily stock price information from both Google and Yahoo! Finance as well as helpful utility functions. It furthermore contains a (basic but decent
- 17.3K (All time)
- 9 (Last 30 days)
- 4.9 / 5
- Community
-
10 Jan 2014
Extract Text from Multiple PDF files across Multiple Folders
When you have desired text in PDF documents saved in many folders
conventional PDF text reader. This code was primarily put together from two sources. I recommend reading the first link as you must download the toolbox for this code to work. Extract text from single document
- 104 (All time)
- 1 (Last 30 days)
- 5.0 / 5
- Community
-
10 Sep 2019
Extract data points from a 2D graph.
This function extracts a user-defined number of data points from a given image of a black-and-white graph.
- 20 (All time)
- 1 (Last 30 days)
- -- / 5
- Community
-
2 Sep 2019

Data Acquisition Toolbox Support Package for National Instruments NI-DAQmx Devices
Acquire and analyze data from NI-DAQmx devices.
Data Acquisition Toolbox™ Support Package for National Instruments® NI-DAQmx Devices enables you to communicate with the National Instruments hardware remotely from a computer running MATLAB®. Using
- 46.2K (All time)
- 209 (Last 30 days)
- 2.4 / 5
- MathWorks
-
22 Jul 2026

Matlab function for extraction of phase from interferogram
phase of the interferogram is extracted.
: extracted phase in form of matrix (radian unit)where data and peak_width are interferogram data (= imread(*.bmp) or imread(*.png)) and width of the side peak in frequency space, respectively. Smaller wide
- 1.4K (All time)
- 2 (Last 30 days)
- 5.0 / 5
- Community
-
4 Nov 2015

Analyzing Weather Data from an Arduino-based weather station
Analyze data from a weather station connected to ThingSpeak
This example illustrates how to analyze data from a weather station connected to ThingSpeak, an IoT analytics platform. The data is visualized and analyzed in MATLAB. The example shows how to
- 5.3K (All time)
- 6 (Last 30 days)
- 4.7 / 5
- Community
-
2 Oct 2019

Industrial Machinery Anomaly Detection
Train an autoencoder on normal operating data from an industrial machine to predict anomalies.
Industrial Machinery Anomaly DetectionThis example applies various anomaly detection approaches to operating data from an industrial machine. Specifically it covers:Extracting relevant features from
- 979 (All time)
- 1 (Last 30 days)
- 5.0 / 5
- Community
-
30 Sep 2021

extract only numbers from text file
This is inspired by Peder's READTEXTand use it to extract numbers only and output an array of only numerical value. The input file can be any numbers mixed with text, symbols,as long as the numbers
- 2K (All time)
- 1 (Last 30 days)
- 5.0 / 5
- Community
-
19 May 2016

Violin Plot based on kernel density estimation, using default ksdensity
. Key Features:a) Specify plotting features as facecolor, edgecolor, etc. b) Provide data with variable column length as cells if wanted, e.g. Y = [100x1 double] [10x1 double]c) Plot Violins on the
- 25.7K (All time)
- 77 (Last 30 days)
- 4.9 / 5
- Community
-
3 Nov 2015

Extract image data from saved fig file
A ".fig" file may have several images embedded within. This function allows you to "find" the image data (findobj) and "get" the image data (cdata) from an open ".fig" file. If the original data is
- 1.8K (All time)
- 1 (Last 30 days)
- 4.0 / 5
- Community
-
19 Jun 2006

The Graph Digitizer Tool is a MATLAB script that enables users to extract data points from graphs in images.
The Graph Digitizer Tool is a MATLAB script that enables users to extract data points from graphs in images. The graphical interface allows users to load an image, select the desired region, and
- 2.6K (All time)
- 94 (Last 30 days)
- 5.0 / 5
- Community
-
13 Nov 2024

sel_and_del Interactively select and delete points from a 2D plot with the mouse
Left click selects a point and right click unselects it.
sel_and_del Obtains a line object xy data from thecurrent figure and axes and proceeds to the interactive selection of the points to delete. Only one line object per axes is supported. [del_points new_dataset
- 1.5K (All time)
- 1 (Last 30 days)
- 5.0 / 5
- Community
-
27 Aug 2009
Extracting Data from BIWI Head pose data base into Matlab (Full)
This submission reads depth images and the ground truth frame by frame from the database.
BIWI Kinect Headpose Data base: This data base has 15000 head poses along with the ground truth of head orientation and location. Below is the URL
- 849 (All time)
- 1 (Last 30 days)
- 3.7 / 5
- Community
-
17 Sep 2012

A graphical tool to modify your plots and locate data points
application. It could also be useful when called directly from the commandline to identify data points or sets of points on a plot, or to delete points (outliers) from a plot. It can be used to return the
- 15.6K (All time)
- 3 (Last 30 days)
- 4.9 / 5
- Community
-
20 Feb 2007
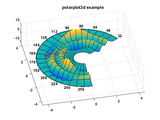
Plots 3d polar data with polar axis and polar grid
Polarplot3d produces surface, mesh, wireframe and contour plots for three dimensional polar data. A labeled polar axis is drawn at a fixed height or it can follow the surface contour at maximum
- 25.7K (All time)
- 9 (Last 30 days)
- 4.9 / 5
- Community
-
4 Mar 2016
Delay Embedding Vector From Data
This scripts creates delayed vectors from data vector. You can chose delay and embedding dimension.
with data from a dynamical systemembed_dimen = this is the dimension we are using to embed datadelta = this is the delay between data.OUTPUTS: Y = this is a matrix where row n is the vector X(n)
- 1.1K (All time)
- 1 (Last 30 days)
- 5.0 / 5
- Community
-
8 Jan 2012

Import Data from Text Files Generated by Cosmed FitMate
Import Cosmed FitMate metabolic data text files into MATLAB.
format, followed by metabolic data in columns. 2. main program readFitmateShell.m calls the function, converts the time to minutes, and plots heart rate and oxygen consumption (VO2).3. function
- 327 (All time)
- 1 (Last 30 days)
- 5.0 / 5
- Community
-
27 Feb 2012

Surface Reconstruction From Scattered Points Cloud
Surface from 3d points
Allows to extract manifold surface from 3d scattered points. Shape can even be non-convex but must represent a closed volume
- 2.1K (All time)
- 2 (Last 30 days)
- 5.0 / 5
- Community
-
14 Jul 2017

(via Excel; with SAS/ACCESS and ActiveX Automation Server)
MySQL-mediated data transfer, discussed in 'The Twain Shall Meet: Facilitating Data Exchange between SAS and Matlab' (see link below).
- 5.3K (All time)
- 3 (Last 30 days)
- 5.0 / 5
- Community
-
4 Apr 2016
Extracts XData & YData for each line given a Figure.
Extracts XData & YData for each line given a Figure.This method could be useful where old simulation results have been saved only as figures.Accepts a handle to the figure. The current figure is
- 163 (All time)
- 1 (Last 30 days)
- 5.0 / 5
- Community
-
12 Aug 2011

gblk: a pedestrian data block extractor
gblk computes segment/offset parameters for very fast extraction of data blocks from a matrix
reused to extract data from other matrices of the same size.the templates can be modified to extract only selected data blocks and/or to extract only selected values from a data block.CELLFUN can be used
- 2.8K (All time)
- 1 (Last 30 days)
- 4.7 / 5
- Community
-
27 Apr 2007
Extracts data from a HDF5 file and returns it as structure to MATLAB.
Extracts data from a HDF5 file and returns it as structure to MATLAB. This uses nested looping and is limited to 16 structures deep. Naturally you can change this.
- 1.8K (All time)
- 1 (Last 30 days)
- 4.0 / 5
- Community
-
28 Mar 2007

Creates a contour plot from polar coordinates
Have you ever wanted to do a contour plot of data in polar coordinates but didn't want to go through the hassle of converting it all to Cartesian coordinates? Well if so, here's your answer. A
- 5.7K (All time)
- 1 (Last 30 days)
- 4.4 / 5
- Community
-
18 Jun 2007

Reading and visualizing data from GY521 module
- 161 (All time)
- 1 (Last 30 days)
- 5.0 / 5
- Community
-
13 Feb 2019
Code for Webinar "Signal Processing and Machine Learning Techniques for Sensor Data Analytics"
Code from Webinar "Signal Processing and Machine Learning Techniques for Sensor Data Analytics"
These files contain all the code necessary to run the example in the Webinar "Signal Processing and Machine Learning Techniques for sensor Data Analytics". They also include code to automate the
- 4.7K (All time)
- 2 (Last 30 days)
- 4.9 / 5
- Community
-
10 May 2016