
Easily create magnifier axis with cliking,dragging and scrolling
h: Figure handle,default: gcf1 Draw a rectangle by dragging open a box to create a magnifier axis2 Click and dragging move the axis3 Scroll to magnify the graph in magnifier axis4 Press ESC to freeze
- 336 (All time)
- 1 (Last 30 days)
- 5.0 / 5
- Community
-
18 Oct 2012

Allows graphical objects to be dragged in a figure.
This function enables a graphical object (be it a line, plot, patch, rectangle, text box, etc.) to be dragged inside an axis, with a very simple syntax ("draggable(h)"), following or not horizontal
- 8.6K (All time)
- 6 (Last 30 days)
- 5.0 / 5
- Community
-
27 Mar 2023

Creates draggable data tips with custom labeling options on some 2-D plots. Custom labels options can also be applied to standard data tips.
This function provides a solution to the limited positions allowed by standard MATLAB Data Tips on some 2-D plots by replacing them with draggable versions when the "Data Tip" mode is toggled off
- 772 (All time)
- 2 (Last 30 days)
- 5.0 / 5
- Community
-
4 Jun 2023
3D Rotation about Shifted Axis
Computes/applies rotation about arbitrary 3D line.
3xN matrix of transformed points, i.e., the input points rotated about the axis. All other input/output arguments have the same meanings as before.
- 6.7K (All time)
- 1 (Last 30 days)
- 5.0 / 5
- Community
-
4 Apr 2021

Enable dragging Matlab plot data-tips
Matlab plots can display data-tips but these cannot be interactively moved except to the 4 corners of the data point. This utility enables the user to interactively drag any newly-created data-tip
- 1.2K (All time)
- 2 (Last 30 days)
- 5.0 / 5
- Community
-
14 Mar 2019

Splits the x-axis into 2 disjoint regions in order to hide an uninteresting portion of a figure.
of tick marks.6.) Obeys ‘Layer’ property7.) Works with semilogy plots and with either axis reversed8.) Can resize after splitting axis8.) Possible to unsplit axisLimitations1.) No support for semilogx
- 10.9K (All time)
- 13 (Last 30 days)
- 4.7 / 5
- Community
-
6 Aug 2013
Allows the user to navigate a 2D/3D plot similar to the Adobe "hand" interface.
DRAG: Move around on a 2-D or 3-D plot.When plot dragging is on, you can click and drag the axes around while maintaining the current level of zoom. In a figure with multiple subplots, pressing and
- 4.1K (All time)
- 1 (Last 30 days)
- 5.0 / 5
- Community
-
30 Jan 2004
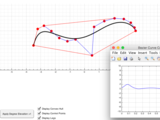
Bezier Curve with draggable control points
Draw, manipulate and reconstruct Bezier Curves.
);- simple application of drag and drop operations with axis elements;- interactive user interface..: How to use :.The simplest way to get started is to run "callObjDeCaste.m" (where you can change the initial
- 1.4K (All time)
- 2 (Last 30 days)
- 4.9 / 5
- Community
-
24 Jan 2021

oaxes - central axis lines through an origin
Draw central axis lines through an origin point.
Oaxes creates a set of axis lines through a specified origin point. Oaxes supports both 2D and 3D views, ticks and tick labels, axis labels, log-scaled axes, and has a plethora of properties
- 6K (All time)
- 1 (Last 30 days)
- 4.9 / 5
- Community
-
7 Aug 2012

Create a draggable rectangle in normalized units.
, arrays of x- and y- points for snap-to behavior, and the axis you want to draw in. Outputs variables can contain a handle to the created rectangle, as well as an array of handles to the draggable perimeter
- 678 (All time)
- 1 (Last 30 days)
- 5.0 / 5
- Community
-
1 Sep 2016

Splits the y axis hiding values within a given range
breakyaxis([minYvalue,maxYvalue])Splits the y axis into two separate regions to avoid unnecessary blank space. The split interval is determined by the y-axis values minYvalue and
- 16.1K (All time)
- 42 (Last 30 days)
- 4.5 / 5
- Community
-
6 Mar 2014
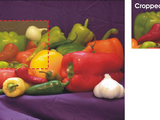
Cropping an Image with draggable rectangle
Crops the Image from a draggable rectangle & displays it (after the figure is closed)
% Crops the Image from a draggable rectangle% & returns the Cropped Image and its co-ordinates%% I is the Image to be cropped assumed to be in the% matlab workspace%% w : width (default value :
- 2.9K (All time)
- 1 (Last 30 days)
- 4.3 / 5
- Community
-
24 Apr 2008

DRAGZOOM allows you to handy interactively manage the axes in figure.
) drag'c' - On/Off Pointer Symbol 'fullcrosshair''g' - On/Off axes grid (only plots)'s' - On/Off smoothing plots'x' - If pressed and holding, zoom and drag works only for X axis'y' - If pressed and holding
- 5.8K (All time)
- 4 (Last 30 days)
- 4.9 / 5
- Community
-
5 Jun 2011

Display multiple images as a montage of subplots
v: hsv colormap j: jet color r: reverse current colormap u: undock current axis m: movie mode Space bar: play/stop movie +/- : increase/decrease FPS Tab: reset layout 0: default window/level 1
- 1.6K (All time)
- 2 (Last 30 days)
- 5.0 / 5
- Community
-
25 Nov 2014
Breaks the Y-axis so that the x-axis will cross the y-axis at 0 and continues at any number
This routine just adds 2 yTicks at the bottom of the y-axis First added ytick will be assigned 0 Second y-tick are two almost horizontal lines to break up the y-axis
- 2.7K (All time)
- 4 (Last 30 days)
- 5.0 / 5
- Community
-
10 Dec 2008

Lines in the GUI can be dragged
run DragLineGUI.m This demo is modeled after Doug Hull excellent demo @:http://blogs.mathworks.com/pick/2008/05/27/advanced-matlab-capture-mouse-movement/but has been revised to work in a file
- 1K (All time)
- 2 (Last 30 days)
- 5.0 / 5
- Community
-
18 Jun 2013

Produces a plot who's y-axis skips to avoid unecessary blank space.
BreakPlot(x,y,y_break_start,y_break_end,break_type)Produces a plot who's y-axis skips to avoid unecessary blank spaceINPUTxyy_break_starty_break_endbreak_type if break_type='RPatch' the plot will
- 15.7K (All time)
- 19 (Last 30 days)
- 4.6 / 5
- Community
-
1 Jul 2003

Axis_Prunelabels -- clean up redundant axis labels
Minimizes redundant axis labels in a grid of subplots
AXIS_PRUNELABELS takes a figure with a grid of subplots (created using either SUBPLOT or custom AXES commands), and (a) forces all the subplots to have the same axis limits, and (b) turns off axis
- 2.1K (All time)
- 1 (Last 30 days)
- 4.5 / 5
- Community
-
1 Sep 2016
Cropping an Image with resizable and draggable rectangle
Crops the Image from a resizable and draggable rectangle & displays it (after the figure is closed)
% Crops the Image from a resizable & draggable rectangle % & displays it (after the figure is closed)%% I is the Image to be cropped, assumed to be in the % matlab workspace%% EXAMPLES%% I =
- 2.2K (All time)
- 1 (Last 30 days)
- 4.0 / 5
- Community
-
22 Aug 2008
Zoom mode (h-axis, y-axis or both axis) set by mouse position
Switch between vertical/horizontal/both axis zoom mode by moving the mouse above the figure.
In a matlab figure, in order to switch between vertical axis zooming and horizontal axis zooming, the user must click on Tools/Option/..., or right-click on the figure and to chose the zoom mode
- 106 (All time)
- 4 (Last 30 days)
- 5.0 / 5
- Community
-
3 May 2017
Drag & Drop functionality for JAVA GUI components
Class for Drag & Drop functionality
obj.DropStringFcn, that listen to drop actions of respectively system files or plain text. The Drag & Drop control class relies on a Java class "MLDropTarget.class" that need to be visible on the Java classpath
- 1.1K (All time)
- 3 (Last 30 days)
- 5.0 / 5
- Community
-
13 Oct 2015

Add an ROI toolbar to your figure
This function adds an ROI toolbar to your figure.
on one of them, you will see more functions in a context menu, such as: * change color * histogram * x-y plot * deleteThanks to the "draggable" made by Francois Bouffard, you can drag around
- 1.4K (All time)
- 1 (Last 30 days)
- 4.7 / 5
- Community
-
18 Jul 2013

A UI for synchronized playback of video files with audio.
An app with standard controls for synchronized playback of video files with audio. Framewise processing of video, and global processing of audio, are facilitated. Drag a marker to scrub through the
- 423 (All time)
- 3 (Last 30 days)
- 5.0 / 5
- Community
-
8 Jan 2019

Magnify contents of dragged rectangle to other figure.
Displays the contents of a displayed draggable rectangle on one axis of a source figure into an axis in a target figure. The difference in the screen size of the target axis and the size of the
- 2.5K (All time)
- 1 (Last 30 days)
- 5.0 / 5
- Community
-
28 Apr 2005

Flow cytometric analysis GUI.
filtered events will be displayed on lineplots and they will have red color in dotplot figures.- defined ROIs can be moved by mouse dragging- the mean and the stdev parameters are always displayed in all
- 4.7K (All time)
- 1 (Last 30 days)
- 4.7 / 5
- Community
-
26 May 2006

Interactive roi definition tool
relating to the roi. The created roi can be dragged and moved to any position of the image with the help of DRAGGABE function (developed by Francois Bouffard, see the help of draggable).ROITOOL generates a
- 6.6K (All time)
- 1 (Last 30 days)
- 4.7 / 5
- Community
-
25 Feb 2008

GUI of Drag link mechanism
Drag_linkIn version 1.0 we have focused on various analysis based on drag link mechanism with respect to position, velocity and acceleration, and other factors such as transmission angle calculation
- 79 (All time)
- 2 (Last 30 days)
- 5.0 / 5
- Community
-
27 Jul 2021

SCALEBAR dragable & resize able
A Matlab Tool for makeup a SCALEBAR+ dragable + resizeable+ unit-support+ menucommand-support ## Prepare```matlabplot(sin(1:0.1:10));obj = scalebar;```FULL DESCRITPTION AT MY GITHUB
- 861 (All time)
- 2 (Last 30 days)
- 5.0 / 5
- Community
-
28 Aug 2022

phymhan/matlab-axis-label-alignment
Align axis labels nicely in parallel with axes in MATLAB (3-D) plots.
This is a simple MATLAB function for axis label alignment. It still works when Projection mode is Perspective or when DataAspectRatio is not [1 1 1].## Functions- `align_axislabel`: it rotates $x
- 7.6K (All time)
- 6 (Last 30 days)
- 4.4 / 5
- Community
-
23 Dec 2017

samexaxis (nice subplots with same x axis)
Makes it alot easier to make nice figures with the same x axis.
subplots that have common x axises USAGE: samexaxis([optionalarguments]) Optional arguments: * YAxisLocation (default='left') : choose left,right, alternate or alternate2 * XAxisLocation
- 13.8K (All time)
- 1 (Last 30 days)
- 4.4 / 5
- Community
-
29 Mar 2005

truncAxis (break X/Y axis | 截断坐标轴)
Create broken axes by truncating X and/or Y axis, supporting logarithmic scaling and reversed axis and resizing the axes based on X/Y range.
Basic usagetruncAxis(gca, 'X', [x1, x2])truncAxis(gca, 'Y', [y1, y2])truncAxis(gca, 'X', [x1, x2], 'Y', [y1, y2]) Where:x1, x2: break points on X-axis, satisfying XLim(1) < x1 < x2 <
- 782 (All time)
- 18 (Last 30 days)
- 5.0 / 5
- Community
-
11 May 2026

Obstacle Configuration Builder
Build your polygonal obstacle configuration and then save it to reuse or modify it later.
(http://it.mathworks.com/help/matlab/matlab_external/using-events.html); - Matlab OOP (https://www.mathworks.com/help/pdf_doc/matlab/matlab_oop.pdf); - simple application of drag and drop operations with axis elements; - interactive user interface
- 287 (All time)
- 1 (Last 30 days)
- 5.0 / 5
- Community
-
14 Feb 2017

Move curves with mouse in a MATLAB figure.
area) to disable- Press x or y while draging to constraint x or y movements
- 5.9K (All time)
- 2 (Last 30 days)
- 4.7 / 5
- Community
-
22 Jun 2005

XYrotalabel - rotate X-axis and Y-axis labels
Very simple reliable script giving simple control over label rotation with higher stability
- 1.9K (All time)
- 1 (Last 30 days)
- 5.0 / 5
- Community
-
12 Jan 2016
Rotate three-dimensional vector(s) about a specified axis by a specified angle.
This is a very simple program that implements Rodrigues's rotation formula. Inputs are arrays of three-dimensional column or row vectors that are to be rotated about a specified axis by a specified
- 2.4K (All time)
- 1 (Last 30 days)
- 5.0 / 5
- Community
-
3 Jan 2012
Adds a linked second x axis to a plot
the two axes are linked together. This gives a much more intuitive behaviour, for example clicking in the figure window will select the original axis. It also alows you to drag the plot around, resize
- 3.9K (All time)
- 1 (Last 30 days)
- 4.5 / 5
- Community
-
13 Sep 2006
Updated version of MATLAB FEX draggable by François Bouffard. Now works with UIAxes and UIFigure.
See comments in "draggable.m" and "DraggableDemo.m" for documentation.This release should be completely backwards compatible with the function calls used by the original. It is not backwards
- 103 (All time)
- 1 (Last 30 days)
- -- / 5
- Community
-
30 Jul 2020

- 590 (All time)
- 1 (Last 30 days)
- 5.0 / 5
- Community
-
20 Jun 2024

Joystick Adaptor 4 axis & Buttons
Access to the installed Joysticks from MATLAB.
The Joystick Adaptor 4 axis & Buttons is an upgrade of Roberto Waissman's Joystick Adaptor for two axis only. It allows access to installed joysticks in MS Windows operating systems based on NT
- 3.4K (All time)
- 1 (Last 30 days)
- 5.0 / 5
- Community
-
9 Nov 2005

Enigma M3 Emulator
types•ring offsets of the rotors•reflector type•plugboard connectionsYou can also modify the position of the rotors by hovering over the rotor images and using the scroll-wheel of the mouse or dragging up or
- 2.5K (All time)
- 2 (Last 30 days)
- 5.0 / 5
- Community
-
17 Feb 2016

- 2.8K (All time)
- 2 (Last 30 days)
- 4.9 / 5
- Community
-
11 Apr 2017

Drag and Drop to and from Matlab Figure
Example Drag and Drop in Matlab Figures from Windows Explorer or Other AppsDrapDropTest creates a simple figure which shows the implementation of dnd using activex.The microsoft RichtextCtrl.1
- 3.8K (All time)
- 1 (Last 30 days)
- 3.0 / 5
- Community
-
10 Sep 2007

Returns the position of a plotted axis region
axis, which may differ from the actual axis position, depending on the axis limits, data aspect ratio, and plot box aspect ratio. The position is returned in the same units as the those used to define
- 5.3K (All time)
- 4 (Last 30 days)
- 4.9 / 5
- Community
-
23 Sep 2021
Set same axis limits to all currently open plots.
SAMEAXES unifies/synchronizes axis limits on different axes and subplots.
SAMEAXES unifies/synchronizes axis limits on different axes and subplots. Calling sameaxes() sets identical limits [the pooled min() and max()] to each axis respectively - which is very handy to
- 653 (All time)
- 1 (Last 30 days)
- 4.8 / 5
- Community
-
21 May 2014

[set & get& drag] the line in figure, and get its [draggin-callback] as your wish.
You can [set & get& drag] the line(“dragLine”) position. When dragged, it can run your by set the obj Interface. [dragLine and dragRangle ] have almost the same properties and operation
- 449 (All time)
- 1 (Last 30 days)
- 5.0 / 5
- Community
-
12 Jan 2016
Dragging source point for Orthotomic curve.
Drawing a conic curve. Click mouse for a source point, an orthotomic curve is drawed. Be able to drag that source point for another orthotomic curve.
- 907 (All time)
- 1 (Last 30 days)
- 4.0 / 5
- Community
-
7 Apr 2004
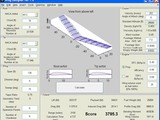
Wing Designer computes aircraft performance measures from wing and engine parameters.
performance. Lift, drag, range and other performance measures are calculated. Range in miles is the basis for the score, and several modifications are made for other measures such as wing span and bending
- 9.2K (All time)
- 7 (Last 30 days)
- 5.0 / 5
- Community
-
2 Jul 2007

Add multiple X or Y axes to plots, rescale data, use any function, add data tips, zoom, flexible.
This package will allow you to plot data on multiple X or Y axis. Similar to MATLAB's own plotyy function, but less limiting. Features: Create any combination of X or Y axes, plot multiple lines on
- 2.2K (All time)
- 1 (Last 30 days)
- 3.7 / 5
- Community
-
9 Dec 2015

- 4K (All time)
- 17 (Last 30 days)
- 5.0 / 5
- Community
-
15 Jul 2024

Breaks the x or y axis.
MATLAB function to add an axis break to a plot.CAUTION: break is only aesthetic. Does not alter the plotted data.
- 3.1K (All time)
- 2 (Last 30 days)
- 3.7 / 5
- Community
-
21 Jun 2015

Collocation-based spectral-element toolbox
Functions and example codes for a collocation spectral-element scheme (Chebyshev or Legendre)
- 2.2K (All time)
- 1 (Last 30 days)
- 5.0 / 5
- Community
-
1 Apr 2013

Enable setting the window level (contrast and brightness) by dragging
Enable setting the window level (contrast and brightness) by draggingThis function allows you to adjust the window and level (contrast and brightness) of images by dragging. This is especially useful
- 210 (All time)
- 1 (Last 30 days)
- 5.0 / 5
- Community
-
6 Jul 2020

Adds a 'Wavenumber (cm^{-1})' axis on top of current graph where the the x-axis is in nm or µm.
ha2=addinvcmaxis(DecPlaces,Unit,ha)Adds a 'Wavenumber (cm^{-1})' axis on top of current graph where the the x-axis is in nm or µm. The xlabel should be specified with unit before running addinvcmaxis
- 182 (All time)
- 2 (Last 30 days)
- 4.0 / 5
- Community
-
24 Sep 2015

The shortest distance(orthogonal distance) from a point to Ellipsoid or Hyperboloid
Standart Hyperboloid equation centered at the origin Parameters: * X, [x y z] - A point Cartesian coordinates data, n x 3 matrix or three n x 1 vectors * axis,[a; b; c] - ellipsoid radii [a; b
- 581 (All time)
- 2 (Last 30 days)
- 5.0 / 5
- Community
-
8 Jul 2017

- 283 (All time)
- 2 (Last 30 days)
- 5.0 / 5
- Community
-
16 Jul 2024

Draw two figures with separate x and y axis
This script plots two sets of 1D data on the same figure.
This script plots two sets of 1D data on the same figure with two separate axis and with the same gridding. The code also checks if the x-axis data are the same, if the x-axis dataare not the same
- 668 (All time)
- 1 (Last 30 days)
- 5.0 / 5
- Community
-
24 Jun 2011
Separating Axis theorem - MATLAB implementation
Used to find if two quadrilaterals intersect
The Separating Axis Theorem (SAT) is used to check if two oriented bounding boxes intersect. This can be used in collision detection or checking for bounding box intersection in pattern recognition
- 617 (All time)
- 1 (Last 30 days)
- 5.0 / 5
- Community
-
30 Aug 2012

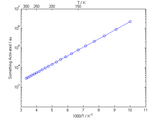
Add top X-axis with different scale
Add an X-axis on top (additional to the one on bottom) of the figure, with its own ticks labels ...
Add an X-axis on top (additional to the one on bottom) of the figure, with its own ticks labels and axis label (allow double scale).Ticks, minor ticks positions and x limits are set to be identical
- 11.6K (All time)
- 3 (Last 30 days)
- 4.5 / 5
- Community
-
29 Nov 2005

Multiple Rapidly-exploring Random Tree (RRT)
Multiple RRT implementation for mobile robot path planning or C-space manipulator motion planning
% See Usage section in RrtPlanner.m file. This is a basic example of usage:treesMax = 28; %How many multiple trees (must be at least 2, 1 for source and 1 for destinationseedsPerAxis = 3; %Number of
- 7.2K (All time)
- 1 (Last 30 days)
- 5.0 / 5
- Community
-
31 Oct 2013
Major Axis Regression (Principal Axis Regression).
research and controversy are continuing and definitive recommendations are difficult to make. In Sokal and Rohlf (1981, 2nd ed.), the numerical result for major axis regression for the example data set is
- 611 (All time)
- 1 (Last 30 days)
- 5.0 / 5
- Community
-
17 Jun 2010