Vectors
Vectors
Vectors is a set of MATLAB tools for the creation of 3D (and 2D) scientific drawings and illustrations. It currently contains the following functions:
- vector, which draws a fully customizable 3D vector,
- vectorupdate, a helper function that updates vector properties and restores the appearance of vectors that were inadvertently modified,
and the utility function points2axes.
Purpose
Producing high-quality illustrations and drawings in 3D for math-related disciplines is a surprisingly difficult endeavor due to the lack of dedicated illustration software.
PowerPoint has some built-in drawing capabilities that are easy to use but limited in scope, while more capable vector-based drawing programs such as Adobe Illustrator or Inkscape have steep learning curves. Most importantly, all of these tools are designed for drawing on two-dimensional canvases and do not inherently support 3D scenes or 3D rendering and shading. CAD software is better suited for this purpose, but is notoriously difficult to learn and too cumbersome for purely illustrative purposes. Research scientists and science instructors alike often have to juggle between these and other programs to obtain the desired results.
MATLAB's visualization engine, on the other hand, is built for 3D scenes and supports basic lines and surfaces out of the box. It is the goal of this toolkit to expand on these capabilities with a growing set of ready-to-use, high-level shapes and functions geared toward the creation of publication-quality illustrations and drawings for scientific research and education.
Requirements
The Vectors toolkit is compatible with MATLAB R2021a and later releases.
Feedback
Any feedback or suggestions are welcome!
vector
vector draws a fully customizable 3D vector.
Usage
vector(O,P) draws a three-dimensional vector from origin O to point P in the current axes if both points are specified as row vectors containing the respective Cartesian coordinates, [x,y,z]. If O and/or P are specified as matrices, [x1,y1,z1; x2,y2,z2; ...], then multiple vectors are drawn. If O is a row vector and P is an N-by-3 matrix, then N vectors are drawn from point O to the points given by the rows of P (and vice-versa). If both O and P are N-by-3 matrices, then N vectors are drawn from the points given by the rows of O to the points given by the corresponding rows of P.
H = vector(O,P,...) returns the handle H of a Group object containing the vector(s) from O to P.
Vector properties are based on the following vector components: the cone (arrowhead), the shaft, and an optional sphere marking the origin. The cone itself consists of the base, the rim, the outer cone surface, and the tip. The cone is slightly beveled in order to improve its appearance at certain angles.
vector(O,P,style) draws a vector or group of vectors with properties specified in short form by the character vector style. style can contain any or all of the following properties in any order: the main color, the width (diameter) of the shaft in points, where 1 point = 1/72 of an inch, and the tip highlight mode (see below for more details).
Shaft width in points: simple decimal notation (default: 1 point)
| Main color | |
|---|---|
'r' |
red |
'g' |
green |
'b' |
blue |
'c' |
cyan |
'm' |
magenta |
'y' |
yellow |
'k' |
black (default) |
'w' |
white |
| Tip highlight mode | |
|---|---|
'' |
never (default) |
'*' |
always |
'o' |
only when facing camera |
If a property is specified more than once (as in style = 'rg'), then only the first occurrence ('r') is taken into account. Invalid characters in style will be ignored.
vector(..., Name-Value-Pairs) specifies vector properties using comma-separated 'Name',Value syntax or the equal-sign syntax Name=Value introduced in R2021a. The following properties can be assigned:
-
'Color': Main color of the vector(s), specified as an RGB triplet; this overrides any color specified instyle. The default is black. The main color is the default color for all vector parts except for the base and the tip. -
'ConeColor': Color of the outer cone surface including bevel, specified as an RGB triplet. The default is the main color. -
'RimColor': Color of the rim, specified as an RGB triplet. The default is the cone color. -
'BaseColor': Color of the base (inside the rim), specified as an RGB triplet. The default is a lighter shade of the cone color, or light grey if the cone color is white. -
'TipColor': Color of the highlighted tip, specified as an RGB triplet. The default is a lighter shade of the cone color, or light grey if the cone color is white. Note that the tip uses'TipColor'only if'TipMode'is set to'*', or set to'o'and the vector in question is directly facing the camera. If the tip is not highlighted, the default color is the cone color. -
'SphereColor': Color of the sphere marking the origin, specified as an RGB triplet. The default is the main color. -
'TipMode': Tip highlight mode (''(default)|'*'|'o'); this overrides any mode specified instyle. In default mode, the tip is not highlighted but uses the same color as the rest of the outer cone surface. If the mode is set to'*', the tip is highlighted using'TipColor'. If the mode is set to'o', the tip is highlighted using'TipColor'but only if the vector in question is directly facing the camera. -
'SphereDiameter': Diameter of the sphere marking the origin specified in points, where 1 point = 1/72 of an inch. The default is 0 (no sphere). -
'ShaftWidth': Width (diameter) of the shaft in points, where 1 point = 1/72 of an inch; this overrides any width specified instyle. The default is 1 point. Note that the default cone width and default cone length scale linearly with'ShaftWidth'. -
'ConeWidth': Maximum width of the cone in points, where 1 point = 1/72 of an inch. The default is 12 times'ShaftWidth'. -
'ConeLength': Full length of the cone in points, where 1 point = 1/72 of an inch. This does not include the cone bevel, which adds 0.5 points. The default is 3 times'ConeWidth'. Note that a cone appears in its full length only if the vector is parallel to the viewing plane. -
'TipFraction': Ratio of the length of the tip to the full length of the cone, expressed as a fractional value between 0 and 1. The default is 0.2. -
'RimFraction': Ratio of the rim thickness to the rim radius, expressed as a fractional value between 0 and 1. The rim radius is half the cone width, minus the bevel of 0.5 points. The default is 0.18, which corresponds to a 1 point rim for the default vector. -
'NumPoints': Number of points around the vector circumference, specified as a positive whole number. The minimum is 2; the default is 50.
Notes
A vector will have the intended appearance as long as the axis limits do not change when the vector is drawn. It is therefore strongly recommended to set all axis limits before drawing the vector(s), or to call vectorupdate after drawing the vector(s). vectorupdate can also be called non-programmatically for a vector group by clicking on any vector in the group.
Resizing the figure or axes will also change the vector dimensions. Call vectorupdate in order to restore it to its intended appearance.
Furthermore, vector needs access to the data aspect ratio, which is only reported by MATLAB if the (default) “stretch-to-fill” behavior is disabled. If necessary, vector will therefore change the data aspect ratio mode to 'manual' and issue a warning. If the data aspect ratio is changed after a vector is drawn, call vectorupdate to restore the vector to its intended appearance.
Example
figure; view(-30, 15); axis equal; axis off; axis([-0.5 1 -0.5 1 -0.5 1]);
% draw Cartesian unit vectors with a red sphere at the origin
vector([0 0 0], [1 0 0; 0 1 0; 0 0 1], SphereDiameter=6, SphereColor=[1 0 0]);
vectorupdate
vectorupdate updates or restores vectors.
Usage
vectorupdate restores the appearance of vectors that were distorted or changed in size due to changes in figure size, axis limits, or data aspect ratio, and updates vector properties passed as arguments. By default, vectorupdate acts on all vectors found in the current axes. Axis limits are frozen at the current values to ensure that vectors are properly dimensioned after vectorupdate is called.
vectorupdate(h) will only act on the vectors in the vector group specified by h instead of all vectors in the current axes.
vectorupdate(ax) will act on all vectors in the axes specified by ax instead of the current axes.
vectorupdate(fig) will act on all vectors in the current axes of the figure specified by fig instead of the current axes.
vectorupdate(..., Name-Value-Pairs) updates vector properties using comma-separated 'Name',Value syntax or the equal-sign syntax Name=Value introduced in R2021a. All properties that can be passed as arguments to vector are supported. In addition, the vector origin(s) and endpoint(s) can be changed using the properties 'O' and 'P', respectively.
h = vectorupdate(...) returns the handle h of a Group object containing the restored or updated vectors.
Notes
The figure and axes containing the restored or updated vectors will become the current figure and current axes, respectively, when vectorupdate is executed.
Example
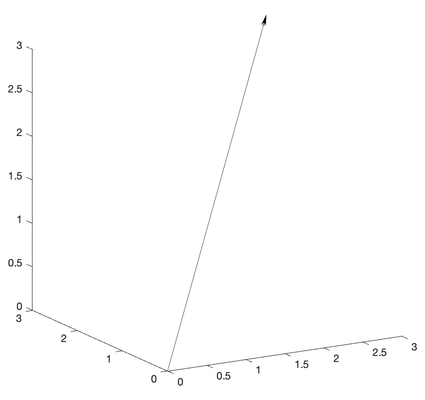
% draw a 3D vector but let MATLAB automatically choose axis limits
figure; view(-30, 15); axis equal;
vector([0 0 0], [3 3 3]);
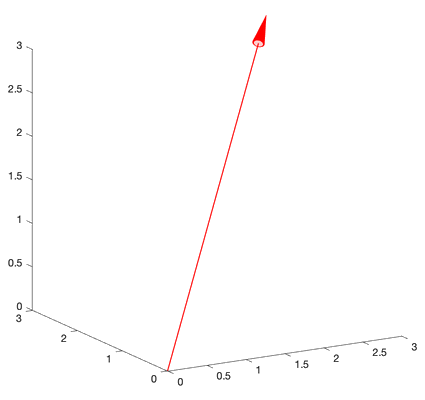
The vector is drawn based on the axis limits that are in effect before vector is called. MATLAB automatically adjusts the limits in order to accommodate the new vector, which in turn affects the vector's appearance. Call vectorupdate to correct this problem, as recommended by the warning issued by vector.
% axis limits have changed -> vectorupdate; let's also change the color to red
vectorupdate(Color=[1 0 0]);
Cite As
Jorg Woehl (2025). Vectors (https://github.com/JorgWoehl/Vectors/releases/tag/v1.0.1), GitHub. Retrieved .
MATLAB Release Compatibility
Platform Compatibility
Windows macOS LinuxTags
Community Treasure Hunt
Find the treasures in MATLAB Central and discover how the community can help you!
Start Hunting!Discover Live Editor
Create scripts with code, output, and formatted text in a single executable document.
| Version | Published | Release Notes | |
|---|---|---|---|
| 1.0.1 | See release notes for this release on GitHub: https://github.com/JorgWoehl/Vectors/releases/tag/v1.0.1 |
||
| 1.0.0.1 | See release notes for this release on GitHub: https://github.com/JorgWoehl/Vectors/releases/tag/v1.0.0.1 |
||
| 1.0 |


