Violin Plots for plotting multiple distributions (distributionPlot.m)
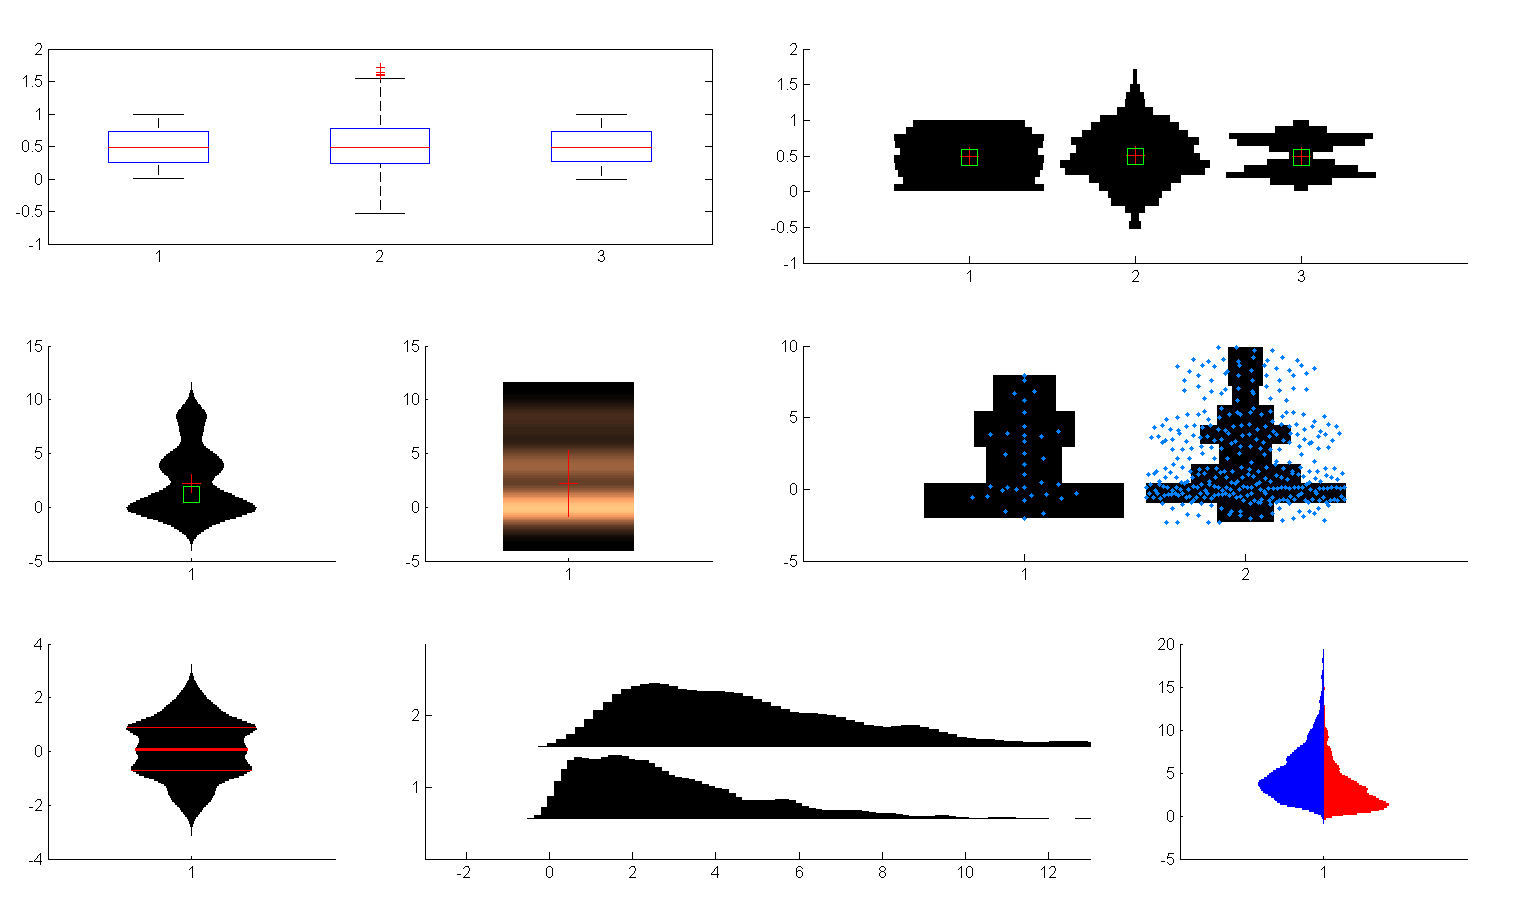
Function for plotting multiple histograms side-by-side in 2D - better than boxplot.

You are now following this Submission
- You will see updates in your followed content feed
- You may receive emails, depending on your communication preferences
Editor's Note: This file was selected as MATLAB Central Pick of the Week
Cite As
Jonas (2026). Violin Plots for plotting multiple distributions (distributionPlot.m) (https://se.mathworks.com/matlabcentral/fileexchange/23661-violin-plots-for-plotting-multiple-distributions-distributionplot-m), MATLAB Central File Exchange. Retrieved .
General Information
- Version 1.15.0 (30.9 KB)
MATLAB Release Compatibility
- Compatible with any release
Platform Compatibility
- Windows
- macOS
- Linux
| Version | Published | Release Notes | Action |
|---|---|---|---|
| 1.15.0 | renamed histogram to myHistogram to avoid clash with new Matlab function of the same name, added support for boxplot overlays |
||
| 1.14.0 | Improved documentation (more examples, link to plotSpread), added quantiles (thanks to Warwick for suggestion & testing). Also, belated thanks to Kelly for suggesting horizontal orientation. |
||
| 1.13.0 | Added the following new features:
Additionally, plotSpread is now a separate submission. |
||
| 1.12.0 | Added option to align the bars at the left or the right (option "histOri"), as suggested by Yuri. Also, bugfix. |
||
| 1.9.0 | Improved normalization options. Thanks to Jake for the suggestion. |
||
| 1.7.0 | Fixed a bug in the code, and two mistakes in the example. |
||
| 1.6.0 | Made colorbar more meaningful if there is only one colormap and the bins are normalized globally (i.e. globalNorm is set to 1). Thanks to Brian Katz for the suggestion. |
||
| 1.4.0 | Changed input from optional arguments to parameterName/parameterValue pairs (note that the old syntax still works!).
|
||
| 1.3.0 | Updated title to Violin Plot, because that's how (part) of these plots are called elsewhere. |
||
| 1.2.0 | Documented previously undocumented functionality, chose better screenshot to demonstrate how distributionPlot is better for comparing distributions than boxplot |
||
| 1.1.0 | Fixed cryptic error if the data was all NaNs (thanks Christopher for pointing it out!).
|
||
| 1.0.0 |

