
Q_band_ZB_3dplot

Q_band_ZB_3dplot
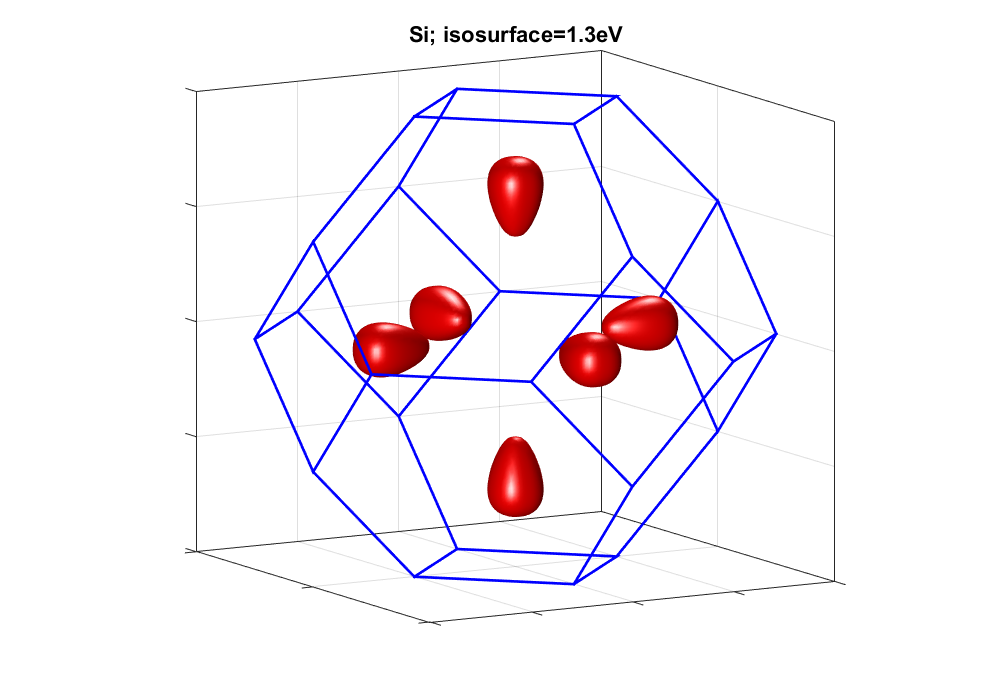
Computes and plot the electrons distribution in the ZB Brillouin zone
It uses the tight-binding model sp3s* where the parameters a from the following references:
-> for the III-V: KLIMECK et al, Superlattices and Microstructures, Vol. 27, No. 5/6, 2000
-> for Si: KLIMECK et al, Superlattices and Microstructures, Vol. 27, No. 2/3,2000
-> for Ge: VOGL et al, I. Phys. Chom. Solids Vol. 44, No. 5. pp. 365-378, 1983


Cite As
Laurent NEVOU (2024). Q_band_ZB_3dplot (https://github.com/LaurentNevou/Q_band_ZB_3dplot), GitHub. Retrieved .
MATLAB Release Compatibility
Platform Compatibility
Windows macOS LinuxTags
Community Treasure Hunt
Find the treasures in MATLAB Central and discover how the community can help you!
Start Hunting!Discover Live Editor
Create scripts with code, output, and formatted text in a single executable document.
Versions that use the GitHub default branch cannot be downloaded
| Version | Published | Release Notes | |
|---|---|---|---|
| 1.0.1 | image updated |
|
|
| 1.0.0 |
|
You can also select a web site from the following list
Americas
- América Latina (Español)
- Canada (English)
- United States (English)
Europe
- Belgium (English)
- Denmark (English)
- Deutschland (Deutsch)
- España (Español)
- Finland (English)
- France (Français)
- Ireland (English)
- Italia (Italiano)
- Luxembourg (English)
- Netherlands (English)
- Norway (English)
- Österreich (Deutsch)
- Portugal (English)
- Sweden (English)
- Switzerland
- United Kingdom (English)
Asia Pacific
- Australia (English)
- India (English)
- New Zealand (English)
- 中国
- 日本Japanese (日本語)
- 한국Korean (한국어)