Using Wavelet Time-Frequency Analyzer App
This example shows how to use the Wavelet Time-Frequency Analyzer app to visualize the scalogram of a 1-D signal. The scalogram is the absolute value of the continuous wavelet transform (CWT). You can adjust wavelet parameters, voices per octave, and frequency limits to use in the CWT. You can compare multiple scalograms and export a scalogram to your workspace. You can also recreate the scalogram in your workspace by generating a MATLAB® script.
Import Data
Load the wecg signal into the MATLAB workspace. The sampling frequency is 180 hz.
load wecg
Fs = 180;
Visualize Scalogram
Open Wavelet Time-Frequency Analyzer. On the Analyzer tab, click Import Signals. A window appears with a list of all the workspace variables the app can process. Select the wecg signal and click Import. After a brief, one-time initialization, the name and type of the imported signal populates the Signals pane. The app displays the scalogram in the Scalogram-wecg plot. The app generates the scalogram using the analytic Morse (3, 60) wavelet and the cwt function with default settings. The cone of influence shows areas in the scalogram potentially affected by edge-effect artifacts. You should treat shaded regions outside the dashed white lines as suspect due to the potential for edge effects. To learn more about the cone of influence, see Boundary Effects and the Cone of Influence.
You can hide or display the cone of influence boundary line or shade the boundary region by setting the option in the Preferences ▼ menu. If the signal is complex-valued, you can also choose to display the positive (counterclockwise) and negative (clockwise) components as either separate or concatenated scalograms. The options you choose in the Preferences ▼ menu persist across MATLAB sessions.
By default, because the signal is not a timetable, the app plots the frequencies in cycles/sample, and uses the sample index as the basis of the time axis. If the imported signal is a timetable, the app plots the scalogram as a function of frequency in hertz and uses the row times of the timetable as the basis for the time axis.
On the Analyzer tab, select the Sample Rate radio button. The axes labels in the scalogram update using the default sampling rate of 1 hz. To set the axes labels appropriately for the wecg signal, apply the value 180 in the Sample Rate field. You cannot modify the sample rate for timetables.

Modify Wavelet Parameters
To access the CWT parameters used to create the scalogram, click the Scalogram tab. The parameters correspond to input arguments of the cwt function. Parameter settings are the default values. Because you set the sampling rate, the minimum and maximum frequency limits are in hertz. The default frequency limits depend on the wavelet, signal length, sampling rate, and voices per octave. For more information, see cwtfreqbounds.

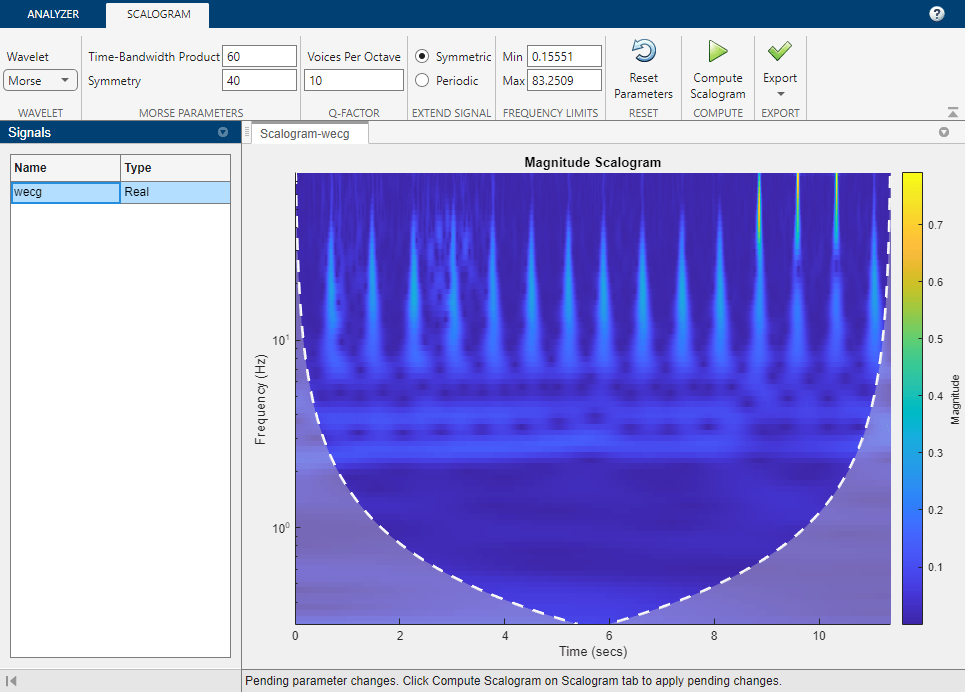
To obtain the scalogram using the Morse (40,60) wavelet, first, change the Morse symmetry parameter in the Symmetry text box to 40. Then, to enter the new value, either press the Enter key on your keyboard or click the mouse anywhere outside the text box.
The Compute Scalogram button is now enabled.
The frequency limits update because you changed the wavelet.
In the status bar, text appears stating there are pending changes.
You can reset the CWT parameters to their default values at any time by clicking Reset Parameters. Resetting the parameters enables the Compute Scalogram button.
Note: To prevent invalid settings, the app immediately validates any parameter you change. If you enter an invalid value, the app automatically replaces it with a valid value. The app treats the following values as invalid:
A very low minimum frequency value
A time-bandwidth product value that violates a constraint the Morse wavelet parameters must satisfy
The new value might not be the desired value. To avoid unexpected results, you should ensure any value you enter always results in a valid setting. For more information, see the example Adjust Morse Wavelet Parameters.

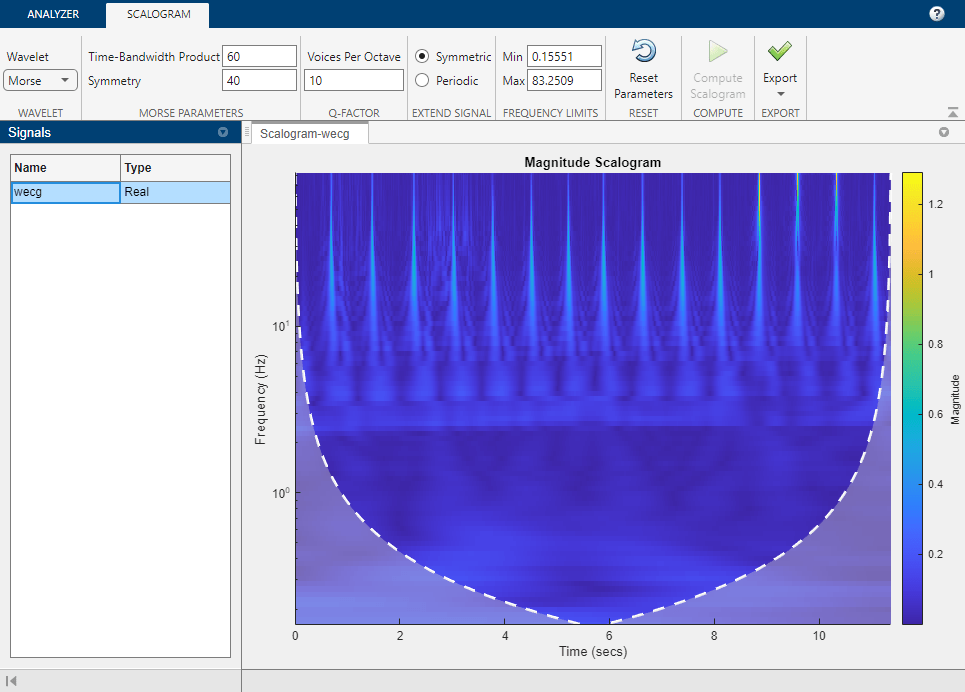
To apply your changes and visualize the new scalogram, click Compute Scalogram.

Compare Scalograms
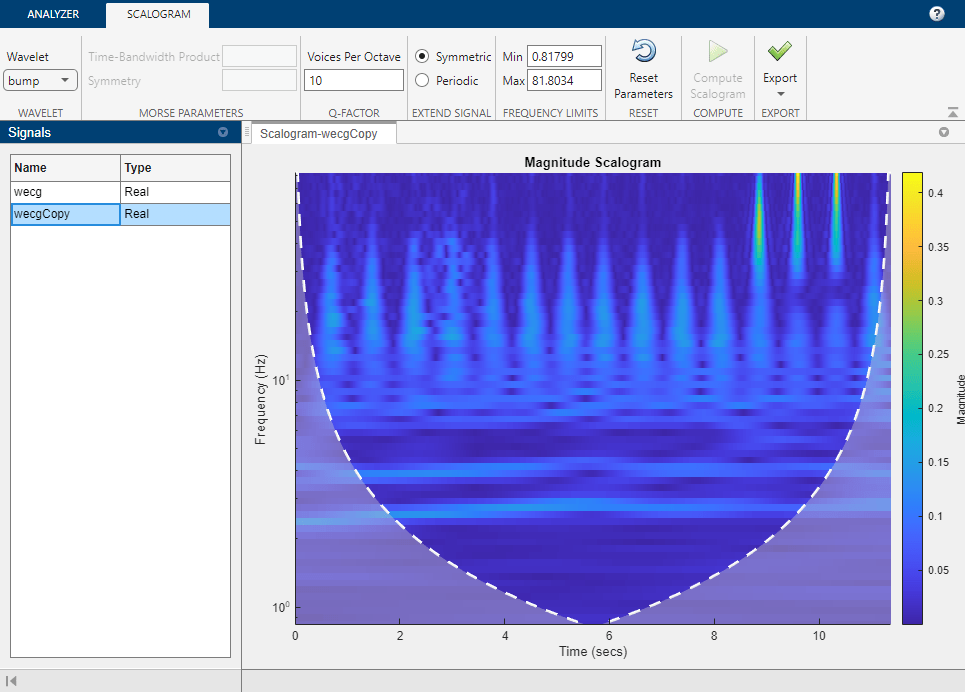
To compare the current scalogram with one obtained using the bump wavelet, first click the Duplicate button on the Analyzer tab. A second signal, wecgCopy, appears in the Signals pane. The scalogram of the duplicate appears in the Scalogram-wecgCopy plot. Then in the Scalogram tab, select bump from the Wavelet dropdown menu. Observe the Morse wavelet parameters are now disabled, and the frequency limits are updated. To create the scalogram with the bump wavelet, click Compute Scalogram. To compare with the first scalogram, select wecg in the Signals pane.

Export Results
You can export a structure array to your workspace that contains the CWT of the selected signal. You can also generate a MATLAB® script to recreate the scalogram in your workspace.
Export Structure
To export the CWT of wecgCopy, select that signal in the Signals pane. Then select Export Scalogram from the Export ▼ menu to create the structure array wecgCopy_scalogram in your workspace. The structure array has three fields:
coefficients— CWT coefficientsfrequencyVector— Scale-to-frequency conversionstimeVector— Time vector
You can use the field values to visualize the scalogram in a new figure by executing these commands:
figure

pcolor(wecgCopy_scalogram.timeVector, ...
    wecgCopy_scalogram.frequencyVector, ...
    abs(wecgCopy_scalogram.coefficients))
shading flat
set(gca,"yscale","log")
title("Scalogram")
xlabel("Time (s)")
ylabel("Frequency (Hz)")
Generate Script
To generate a script that recreates the scalogram of the wecg signal in your workspace, select the wecg signal in the Signals pane. Then select Generate MATLAB Script from the Export ▼ menu. The app generates the script using the name of the signal you selected in the Signals pane. An untitled script opens in your MATLAB Editor with the following executable code.
%Parameters
sampleRate = 180;
waveletParameters = [40,60];

%Compute time vector
t = 0:1/sampleRate:(length(wecg)*1/sampleRate)-1/sampleRate;

%Compute CWT
%If necessary, substitute workspace variable name for wecg as first input to cwt() function in code below
%Run the function call below without output arguments to plot the results
[waveletTransform,frequency] = cwt(wecg, sampleRate,...
    WaveletParameters = waveletParameters);
scalogram = abs(waveletTransform);
Save and execute the script. You can use the workspace variables scalogram, t, and frequency to visualize the scalogram.
subplot(2,1,1)
pcolor(t,frequency,scalogram)
shading flat
set(gca,"yscale","log")
title("Scalogram")
ylabel("Frequency (Hz)")
xlabel("Time (s)")
subplot(2,1,2)
plot(t,wecg)
axis tight
title("Signal")
xlabel("Time (s)")

See Also
Apps
Functions
cwt|icwt|cwtfilterbank|cwtfreqbounds