Visualize and Compare Measured and Predicted Tidal Depths
This example shows how to compare the measured and predicted tidal depth at Ockway Bay. Predicting tidal depths is vital: if you are not aware of the water depth, your boat can get easily stuck in the mud in a shallow bay.
Read Data from the Ockway Bay Real-Time Tide Gauge
ThingSpeak™ channel 50289 contains data about tidal depth at Ockway Bay. The data is collected once every 5 minutes. Field 1 of the channel contains tidal depth data. Read the data using the thingSpeakRead function from channel 50289 on a particular day, for example, July 01, 2016.
startDate = datetime('July 1, 2016 12:01:00 AM');
endDate = datetime('July 2, 2016 12:02:00 AM');
dateRange = startDate:endDate;
data = thingSpeakRead(50289,'DateRange',dateRange,'Fields',1);
Create Data Object and Detrend the Data
Use the iddata function to create an iddata object of the tidal-depth data. As the tidal data is not zero mean, use detrend to make the data have a zero mean.
NOTE: This example is designed to illustrate how an AR model can be used to model a sinusoidal function such as tide level. It is not designed as an alternative to sophisticated tidal forecasting techniques. MATLAB® functions that forecast tide levels using measured tidal data, such as UTide functions are available on MATLAB Central.
sampleTime = 5;
IDdata = iddata(data,[],sampleTime,'OutputName',{'Tidal Depth'},'TimeUnit','minutes')
IDdata = detrend(IDdata,0);
IDdata =

Time domain data set with 288 samples.
Sample time: 5 minutes

Outputs           Unit (if specified)
   Tidal Depth
Fit an AR Model to the Data
Since the tidal depth varies with time, use the ar function to fit a discrete-time autoregressive model to the data.
modelOrder = 8;
sys = ar(IDdata,modelOrder);
Compare the Measured and Predicted Tidal Depths
Use the compare function to compare the accuracy of the predicted model data to that of the measured data.
compare(IDdata,sys,287,'r')
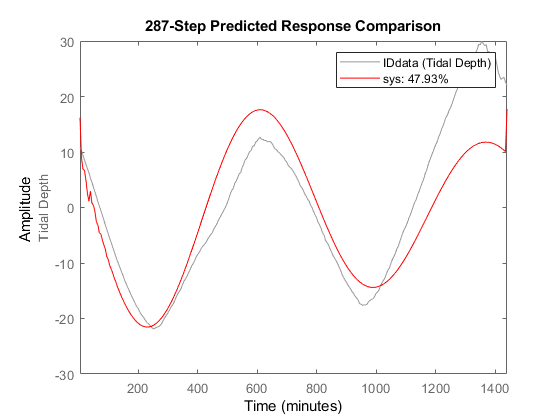
This plot shows how the 287-step-ahead predicted response of the system compares to the measured data.
See Also
Functions
thingSpeakRead|iddata(System Identification Toolbox) |detrend(System Identification Toolbox) |ar(System Identification Toolbox) |compare(System Identification Toolbox)