Predict Class Labels Using Stateflow
This example shows how to use a Stateflow® chart for label prediction. The example trains a discriminant analysis model for the Fisher iris data set by using fitcdiscr, and defines a function for code generation that loads the trained model and predicts labels for new data. The Stateflow chart in this example accepts streaming data and predicts labels using the function you define.
Fisher's iris data set, which is included in Statistics and Machine Learning Toolbox™, contains species (species) and measurements (meas) on sepal length, sepal width, petal length, and petal width for 150 iris specimens. The data set contains 50 specimens from each of three species: setosa, versicolor, and virginica.
Load the Fisher iris data set.
load fisheririsConvert species to an index vector where 1, 2, and 3 correspond to setosa, versicolor, and virginica, respectively.
species = grp2idx(species);
Partition the data into a training set and a test set.
rng('default') % For reproducibility
idx1 = randperm(150,75)';
idx2 = setdiff((1:150)',idx1);
X = meas(idx1,:);
Y = species(idx1,:);
trainX = meas(idx2,:);
trainY = species(idx2,:);
Use trainX and trainY to train a model, and use X and Y to test the trained model.
Train a quadratic discriminant analysis model.
Mdl = fitcdiscr(trainX,trainY,'DiscrimType','quadratic');
Mdl is a ClassificationDiscriminant model. At the command line, you can use Mdl to make predictions for new observations. However, you cannot use Mdl as an input argument in a function for code generation. Prepare Mdl to be loaded within the function by using saveLearnerForCoder.
saveLearnerForCoder(Mdl,'DiscrIris');saveLearnerForCoder compacts Mdl and saves it in the MAT file DiscrIris.mat.
To display the predicted species in the display box of the Stateflow model, define an enumeration class by using a classdef block in the MATLAB® file IrisSpecies.m.
classdef IrisSpecies < Simulink.IntEnumType
  enumeration
    Setosa(1)
    Versicolor(2)
    Virginica(3)
  end
end
For details about enumerated data, see Define Enumerated Data Types (Stateflow).
Define a function named mypredict.m that predicts the iris species from new measurement data by using the trained model. The function should:
Include the code generation directive
%#codegensomewhere in the function.Accept iris measurement data. The data must be consistent with X except for the number of rows.
Load
DiscrIris.matusingloadLearnerForCoder.Return predicted iris species.
function label  = mypredict(X) %#codegen
%MYPREDICT Predict species of iris flowers using discriminant model
%   mypredict predicts species of iris flowers using the compact
%   discriminant model in the file DiscrIris.mat. Rows of X correspond to
%   observations and columns correspond to predictor variables. label is
%   the predicted species.
mdl = loadLearnerForCoder('DiscrIris');
labelTemp = predict(mdl,X);
label = IrisSpecies(labelTemp);
end
Open the Simulink® model sf_countflowers.slx.
sfName = 'sf_countflowers';
open_system(sfName);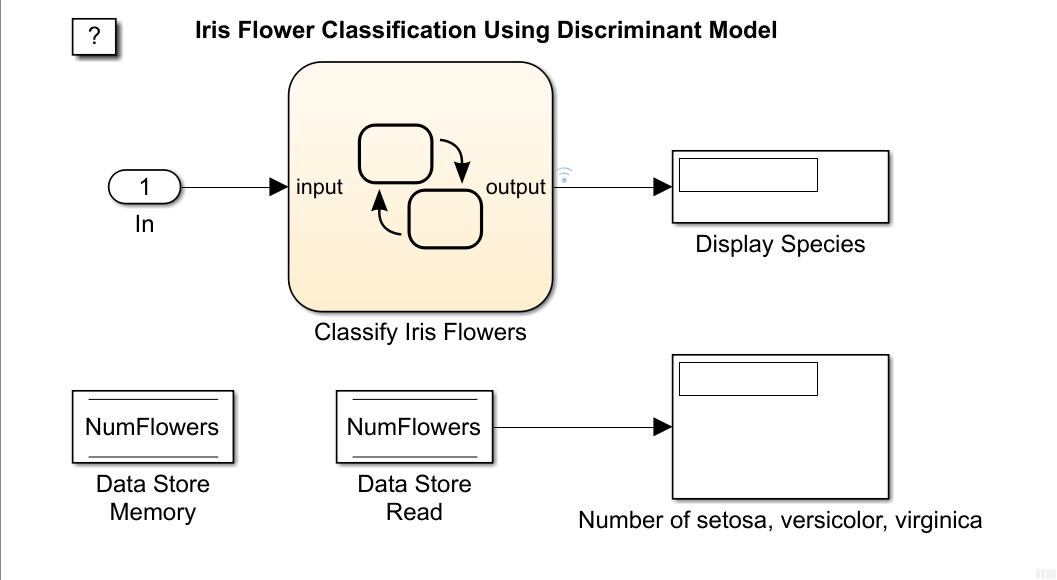
The figures display the Simulink model and the flow graph contained in the Stateflow chart. When the input node detects measurement data, it directs the data into the chart. The chart then predicts a species of iris flower and counts the number of flowers for each species. The chart returns the predicted species to the workspace and displays the species within the model, one at a time. The data store memory block NumFlowers stores the number of flowers for each species.
The chart expects to receive input data as a structure array called fisheririsInput containing these fields:
time- The points in time at which the observations enter the model. In the example, the duration includes the integers from 0 through 74. The orientation oftimemust correspond to the observations in the predictor data. So, for this example,timemust be a column vector.signals- A 1-by-1 structure array describing the input data and containing the fieldsvaluesanddimensions. Thevaluesfield is a matrix of predictor data. Thedimensionsfield is the number of predictor variables.
Create an appropriate structure array for iris flower measurements.
fisheririsInput.time = (0:74)';
fisheririsInput.signals.dimensions = 4;
fisheririsInput.signals.values = X;
You can change the name from fisheririsInput, and then specify the new name in the model. However, Stateflow expects the structure array to contain the described field names. For more details, see Loading Data Structures to Root-Level Inputs (Simulink).
Simulate the model.
sim(sfName)
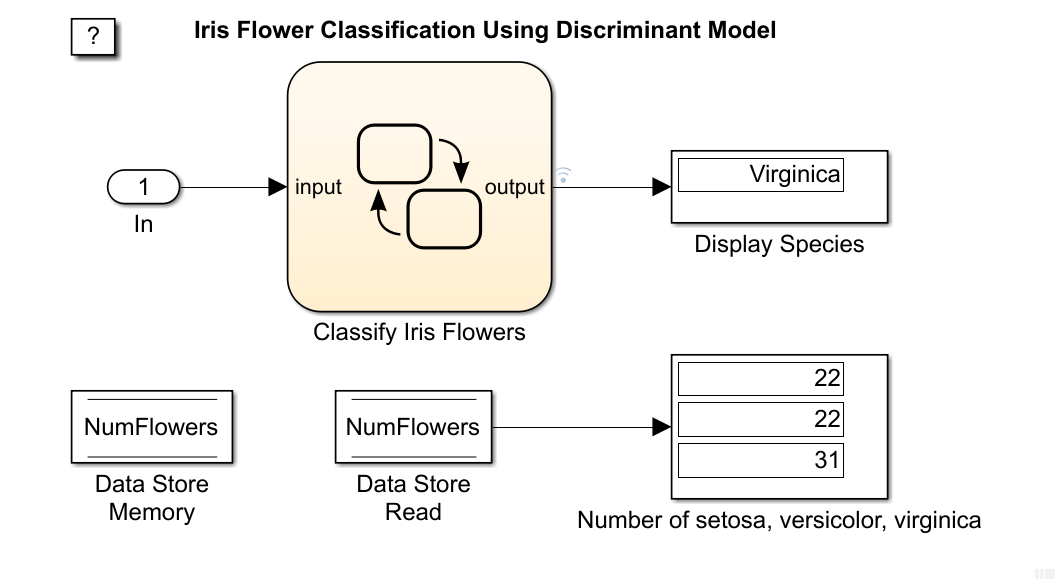
The figure shows the model after it processes all observations in fisheririsInput, one at a time. The predicted species of X(75,:) is virginica. The number of setosa, versicolor, and virginica in X is 22, 22, and 31, respectively.
The variable logsout appears in the workspace. logsout is a SimulinkData.Dataset object containing the predicted species. Extract the predicted species data from the simulation log.
labelSF = logsout.getElement(1).Values.Data;
Predict species at the command line using predict.
labelCMD = predict(Mdl,X);
Compare the predicted species returned by sf_countflowers to those returned by calling predict at the command line.
isequal(labelCMD,labelSF)
ans = logical
   1
isequal returns logical 1 (true) if all the inputs are equal. This comparison confirms that sf_countflowers returns the expected results.
If you also have a Simulink Coder™ license, then you can generate C code from sf_countflowers.slx in Simulink or from the command line using slbuild (Simulink). For more details, see Generate C Code for a Model (Simulink Coder).
See Also
loadLearnerForCoder | saveLearnerForCoder | predict | slbuild (Simulink)
Topics
- Introduction to Code Generation for Statistics and Machine Learning Functions
- Code Generation for Image Classification
- Predict Class Labels Using MATLAB Function Block
- System Objects for Classification and Code Generation
- Human Activity Recognition Simulink Model for Smartphone Deployment
- Chart Programming (Stateflow)