Control Chart Execution by Using Temporal Logic
Temporal logic controls the execution of a chart in terms of time. In state actions and transitions, you can use two types of temporal logic:
Event-based temporal logic tracks recurring events. You can use any explicit or implicit event as a base event.
Absolute-time temporal logic tracks the elapsed time since a state became active. The timing for absolute-time temporal logic operators depends on the type of Stateflow® chart:
Charts in a Simulink® model define absolute-time temporal logic in terms of simulation time.
Standalone charts in MATLAB® define absolute-time temporal logic in terms of wall-clock time, which is limited to 1 millisecond precision.
Temporal Logic Operators
To define the behavior of a Stateflow chart based on temporal logic, use the operators listed in this table. These operators can appear in:
State
onactionsActions on transition paths that originate from a state
Each temporal logic operator has an associated state, which is the state in which the action appears or from which the transition path originates. The Stateflow chart resets the counter used by each operator every time that the associated state reactivates.
| Operator | Syntax | Description | Example |
|---|---|---|---|
after |
| Returns true if the event E
has occurred at least n times since the associated state became
active. Otherwise, the operator returns false. | Display a status message when the chart processes a
broadcast of the event |
Transition out of the associated state when the chart
processes a broadcast of the event after(5,E) | |||
| Returns The implicit event
| Transition out of the associated state when the chart
wakes up for at least the seventh time since the state became active, but only if
the variable after(7,tick)[temp > 98.6] | |
| Returns In charts in a Simulink model, specify time in seconds ( In standalone charts in MATLAB, specify time in seconds ( | Set the | |
at |
| Returns true if the event E
has occurred exactly n times since the associated state became
active. Otherwise, the operator returns false. | Display a status message when the chart processes the
third broadcast of the event |
Transition out of the associated state when the chart
processes the fifth broadcast of the event at(5,E) | |||
| Returns The implicit event
| Transition out of the associated state when the chart
wakes up for the seventh time since the state became active, but only if the
variable at(7,tick)[temp > 98.6] | |
| Returns Using | Set the | |
before |
| Returns The temporal logic operator
| Display a status message when the chart processes the
first and second broadcasts of the event |
Transition out of the associated state when the chart
processes a broadcast of the event before(5,E) | |||
| Returns The implicit event
The temporal logic operator
| Transition out of the associated state when the chart
wakes up, but only if the variable before(7,tick)[temp > 98.6] | |
| Returns Specify time in seconds
( The temporal logic operator
| Set the | |
every |
| Returns | Display a status message when the chart processes every
third broadcast of the event |
Transition out of the associated state when the chart
processes every fifth broadcast of the event every(5,E) | |||
| Returns The implicit event | Transition out of the associated state every seventh
every(7,tick)[temp > 98.6] | |
| Returns Using | Increment the | |
temporalCount |
| Returns the number of occurrences of the event Using
| Access successive elements of the array
|
temporalCount(tick) | Returns the number of times that the chart has woken up since the associated state became active. The implicit event
Using
| Store the value of the input data en,du: M(temporalCount(tick)+1) = u; | |
| Returns the length of time that has elapsed since the associated state became active. Specify time in seconds ( | Store the number of milliseconds since the state became active. en,du: y = temporalCount(msec); | |
elapsed |
| Returns the length of time that has elapsed since the associated state became active. Equivalent to
| Store the number of seconds since the state became active. en,du: y = elapsed(sec); |
et | An alternative way to execute elapsed(sec). | When the chart processes a broadcast of the event
E{disp(et);} | |
count |
| Returns the number of times that the chart has woken up
since the conditional expression The
Stateflow chart resets the value of the In charts in a
Simulink model, the value of | Transition out of the associated state when the variable
[count(x>=2) > 5] |
Store the number of chart executions since the variable
en,du: y = count(x>5); | |||
duration |
| Returns the length of time that has elapsed since the
conditional expression Specify time in seconds
( The Stateflow chart resets the value of the The temporal logic operator | Transition out of the state when the variable [duration(x>=0) > 0.1] |
Store the number of milliseconds since the variable
en,du: y = duration(x>5,msec); |
You can use quotation marks to enclose the keywords 'tick',
'sec', 'msec', and 'usec'. For
example, after(5,'tick') is equivalent to
after(5,tick).
Note
The temporal logic operators after, at,
before, and every compare the threshold
n to an internal counter of integer type. If n is
a fixed-point number defined by either a slope that is not an integer power of two or a
nonzero bias, then the comparison can yield unexpected results due to rounding. For more
information, see Relational Operations for Fixed-Point Data.
Examples of Temporal Logic
Define Time Delays
This example shows how to define two absolute time delays in a continuous-time chart.
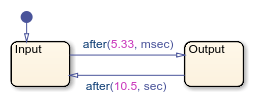
The execution of the chart follows these steps:
When the chart awakens, the state
Inputactivates first.After 5.33 milliseconds of simulation time, the transition from
InputtoOutputoccurs.The state
Inputbecomes inactive and the stateOutputbecomes active.After 10.5 seconds of simulation time, the transition from
OutputtoInputoccurs.The state
Outputbecomes inactive and the stateInputbecomes active.
Steps 2 through 5 are repeated until the simulation ends.
If a chart has a discrete sample time, any action in the chart occurs at integer multiples of this sample time. For example, if the Simulink® solver uses a fixed step of size 0.1 seconds, the first transition from state Input to state Output occurs at t = 0.1 seconds. This behavior applies because the solver does not wake the chart at exactly t = 5.33 milliseconds. Instead, the solver wakes the chart at integer multiples of 0.1 seconds, such as t = 0.0 and 0.1 seconds.
Detect Elapsed Time
In this example, a Step (Simulink) block provides a unit step input to a Stateflow chart.
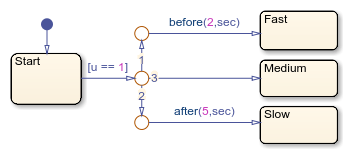
The chart determines when the input u equals 1:
If the input equals 1 before t = 2 seconds, a transition occurs from
StarttoFast.If the input equals 1 between t = 2 and t = 5 seconds, a transition occurs from
StarttoMedium.If the input equals 1 after t = 5 seconds, a transition occurs from
StarttoSlow.
Use Absolute-Time Temporal Logic in Enabled Subsystems
You can use absolute-time temporal logic in a chart that resides in a conditionally executed subsystem. When the subsystem is disabled, the chart becomes inactive and the temporal logic operator pauses while the chart is asleep. The operator does not continue to count simulation time until the subsystem is reenabled and the chart is awake.
This model has an enabled subsystem with the States when enabling parameter set to held.
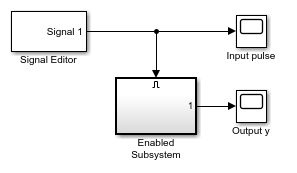
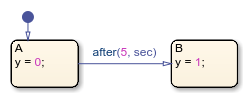
The subsystem contains a chart that uses the after operator to trigger a transition.
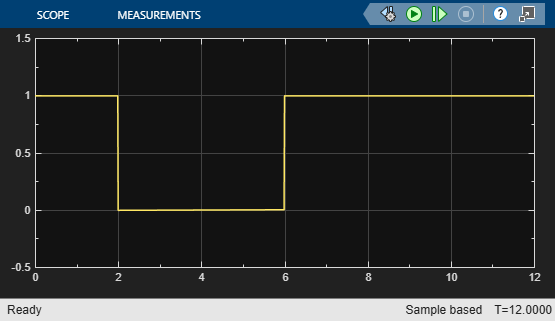
The Signal Editor (Simulink) block provides an input signal with these characteristics:
The signal enables the subsystem at t = 0.
The signal disables the subsystem at t = 2.
The signal reenables the subsystem at t = 6.
This graph shows the total time elapsed in the chart. When the input signal enables the subsystem at time t = 0, state A becomes active. While the system is enabled, the elapsed time increases. When the subsystem is disabled at t = 2, the chart goes to sleep and the elapsed time stops increasing. For 2 < t < 6, the elapsed time stays frozen at 2 seconds because the system is disabled. When the chart wakes up at t = 6, elapsed time starts to increase again.
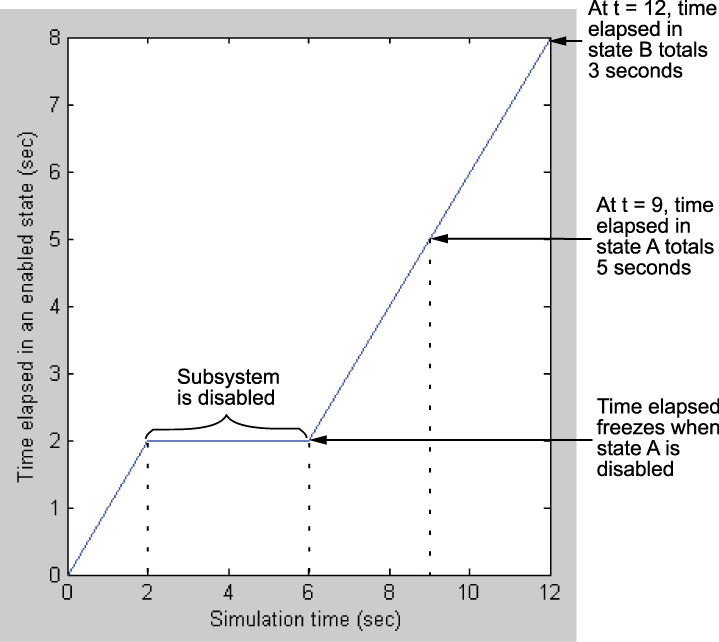
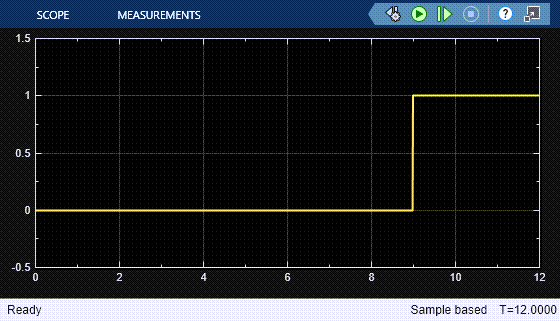
The transition from state A to state B depends on the elapsed time while state A is active, not on the simulation time. Therefore, the transition occurs at t = 9, when the elapsed time in state A equals 5 seconds. When the transition occurs, the output value y changes from 0 to 1.
This model behavior applies only to subsystems where you set the Enable block parameter States when enabling to held. If you set the parameter to reset, the chart reinitializes completely when the subsystem is reenabled. Default transitions execute and any temporal logic counters reset to 0.
Notation for Event-Based Temporal Logic in Transitions
In Stateflow charts in Simulink models, the operators after, at, and
before support two distinct notations to express event-based temporal
logic in a transition.
Trigger notation defines a transition that depends only on the base event for the temporal logic operator. Trigger notation follows this syntax:
where:temporalLogicOperator(n,E)[C]
temporalLogicOperatoris a Boolean temporal logic operator.nis the occurrence count of the operator.Eis the base event of the operator.Cis an optional condition expression.
When you use trigger notation, the transition can occur only when the chart processes a broadcast of the base event
E.Conditional notation defines a transition that depends on base and nonbase events. Conditional notation follows this syntax:
where:F[temporalLogicOperator(n,E) && C]
temporalLogicOperatoris a Boolean temporal logic operator.nis the occurrence count of the operator.Eis the base event of the operator.Fis an optional nonbase event.Cis an optional condition expression.
When you use conditional notation with a nonbase event
F, the transition can occur only when the chart processes a broadcast ofF. If you omit the nonbase event, the transition can occur when the chart is processing any explicit or implicit event.Conditional notation for temporal logic operators is not supported in standalone charts in MATLAB.
For example, this transition label uses trigger notation to indicate a transition out of
the associated state when the chart processes a broadcast of the base event
E, starting on the fifth broadcast of E after the
state became
active.
after(5,E)
In contrast, this transition label uses conditional notation to indicate a transition
out of the associated state when the state has been active for at least five broadcasts of
the base event E, even if the chart is not processing a broadcast of
E.
[after(5,E)]
Note
The operator every supports trigger and conditional notations.
However, both notations are equivalent for this operator. The transition labels
every(5,E) and [every(5,E)] indicate a transition
out of the associated state when the chart processes the
kth broadcast of the base event
E after the state became active, where k is a
multiple of five.
Best Practices for Temporal Logic
Do Not Use Temporal Logic on Transition Paths Without a Source State
The value of a temporal logic operator depends on when its associated state became active. To ensure that every temporal logic operator has a unique associated state, only use these operators in:
State
onactionsActions on transition paths that originate from a state
Do not use temporal logic operators on default transitions or on transitions in graphical functions because these transitions do not originate from a state.
Use Absolute-time Temporal Logic Instead of tick in Charts in Simulink Models
In charts in a Simulink model, the value of delay expressions that use absolute-time temporal logic
are semantically independent of the sample time of the model. In contrast, delay
expressions that use temporal logic based on the implicit event tick
depend on the step size used by the Simulink solver.
Additionally, absolute-time temporal logic is supported in charts that have input
events. The implicit event tick is not supported when a Stateflow chart in a Simulink model has input events.
Do Not Use at for Absolute-Time Temporal Logic in Charts in Simulink Models
In charts in a Simulink model, using at as an absolute-time temporal logic
operator is not supported. Instead, use the after operator. For
example, suppose that you want to define a time delay using the expression
at(5.33,sec).
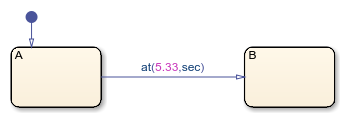
To prevent a run-time error, change the transition label to
after(5.33,sec).
Unexpected Results for Large Parameter Values
A Stateflow absolute time temporal logic condition such as
after(x,sec) might not evaluate to true at the
expected time after entering a state with the following conditions:
The chart has a periodic discrete sample time.
The chart logic makes the state remain active for greater than
2147418units of time. The units of time are the smallest time units in any temporal logic expression used by that state. For example, if the state has two outgoing transitions, one usingafter(x,sec)and the other usingafter(x,msec), the units of time aremsec (milliseconds).
Typically, unexpected results occur when the length of time in the state is bigger
than 2147418 units of time. However, this may change depending on the
sample time of the chart.
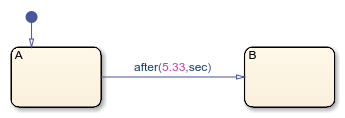
Do Not Use every for Absolute-Time Temporal Logic in Charts in Simulink Models
In charts in a Simulink model, using every as an absolute-time temporal logic
operator is not supported. Instead, use an outer self-loop transition with the
after operator. For example, suppose that you want to print a
status message for an active state every 2.5 seconds during chart execution.
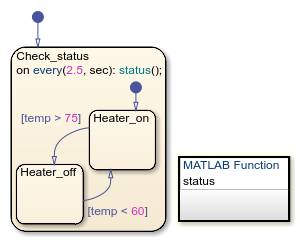
To prevent a run-time error, replace the state action with an outer self-loop transition.
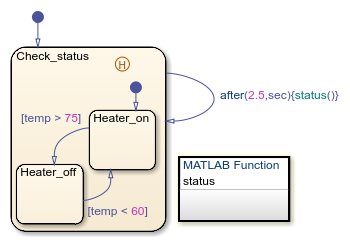
Add a history junction in the state so the chart remembers the state settings prior to each self-loop transition. For more information, see Resume Prior Substate Activity by Using History Junctions.
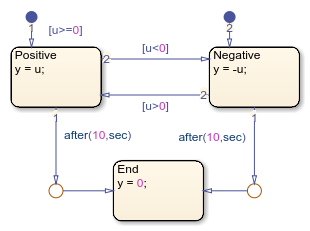
Do Not Use Temporal Logic in Transition Paths with Multiple Sources in Standalone Charts in MATLAB
Standalone charts in MATLAB do not support the use of temporal logic operators on transition paths that
have more than one source state. For example, this standalone chart produces a run-time
error because the temporal logic expression after(10,sec) triggers a
transition path that has more than one source state.
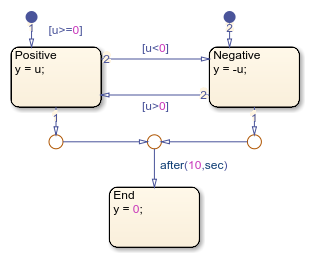
To resolve the issue, use temporal logic expressions on separate transition paths, each with a single source state.
Avoid Mixing Absolute-time Temporal Logic and Conditions in Transition Paths of Standalone Charts in MATLAB
In standalone charts in MATLAB, the operators after, at, and
every create MATLAB
timer objects that generate implicit events to wake up the chart. Combining
these operators with conditions on the same transition path can result in unintended behavior:
If a condition on the transition path is false when the
timerwakes up the chart, the chart performs theduringandonactions of the active state.The chart does not reset the
timerobject associated with the operatorsafterandat. If the condition on the transition path becomes true at a later time, the transition does not take place until another explicit or implicit event wakes up the chart.
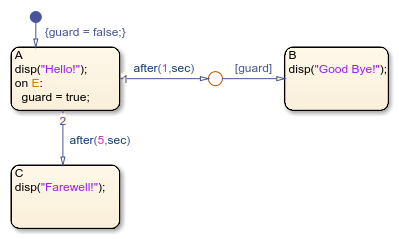
For example, in this chart, the transition path from state A to
state B combines the absolute-time temporal logic trigger
after(1,sec) and the condition [guard]. The
transition from state A to state C has the
absolute-time temporal logic trigger after(5,sec). Each transition is
associated with a timer object that generates an implicit event. Initially,
the local variable guard is false.
When you execute the chart, state A becomes active. The chart
performs the entry action and displays the message
Hello!. After 1 second, the timer associated with the
transition from A to B wakes up the chart. Because
the transition is not valid, the chart executes the during action in
state A and displays the message Hello! a second
time.
Suppose that, after 2 seconds, the chart receives the input event
E. The chart executes the on action in state
A and changes the value of guard to
true. Because the chart does not reset the timer
associated with the operator after, the transition from
A to B does not take place until another event
wakes up the chart.
After 5 seconds, the timer associated with the transition from
A to C wakes up the chart. Because the transition
from A to B is valid and has a higher execution
order, the chart does not take the transition to state C or display the
message Farewell!. Instead, state B becomes active
and the chart displays the message Good bye!.
Use Charts with Discrete Sample Times for More Efficient Code Generation
The code generated for discrete charts that are not inside a triggered or enabled subsystem uses integer counters to track time instead of the time provided by Simulink. This behavior allows for more efficient code generation in terms of overhead and memory, and enables this code for use in software-in-the-loop (SIL) and processor-in-the-loop (PIL) simulation modes. For more information, see SIL and PIL Simulations (Embedded Coder).
See Also
after | at | before | every | temporalCount | elapsed | count | duration | timer | Signal Editor (Simulink) | Step (Simulink)