Symbols Pane
Manage data, events, and messages
Description
Use the Symbols pane to view and manage to manage elements such as data, events, and messages in blocks such as Chart blocks, MATLAB Function (Simulink) blocks, or Requirements Table (Requirements Toolbox) blocks. Use the Symbols pane to add, delete, or modify elements. During simulation, you can also monitor and modify data values directly from the Symbols pane.

Open the Symbols Pane
To open the Symbols pane, in the Modeling tab, select Symbols Pane.
Examples
To add a data, event, or message, in the Symbols pane:
Select one of the element you want to add.
Icon Description 
Add data 
Add event 
Add message In the row for the new element, under Type, choose the data type, event type, or message type.
Edit the name of the element.
For input and output elements, under Port, choose a port number.
To view the element in the Property Inspector, right-click the element and select Inspect.
In the Property Inspector, modify the element properties.
After you add elements through the Symbols pane, the elements appear with an unused symbol warning icon
 until you reference them in your Stateflow® design.
Use the Symbols pane to modify the name, type, and port number of Stateflow elements. Edit the name of elements in the NAME field. When you rename an element, select Shift+Enter to rename all references to the element throughout the chart. To change the type or port number of an element, click the corresponding field and select from the available options. To delete an element, right-click the element and select Delete.
Data, events, or messages are unresolved if they appear in your chart but you do not
confirm their properties in the Symbols pane. When you edit your
chart, Stateflow detects undefined symbols and marks them in the Symbols
pane with a red error icon ![]() . You Stateflow chart or table cannot simulate if there are undefined symbols.
. You Stateflow chart or table cannot simulate if there are undefined symbols.
Create a Simulink® model with an empty chart. In the MATLAB® command prompt, enter
sfnew.In the chart, add states
AandB.Add a default transition to state
Aand transitions between statesAandB.Double-click the default transition. At the text prompt, enter
{x =
                  y;}
. The undefined symbols y and x appear in the Symbols pane.
To resolve the symbols, click the Resolve undefined symbols
 icon. When you use the Resolve undefined symbols
option, the chart automatically assigns each symbol its type.
icon. When you use the Resolve undefined symbols
option, the chart automatically assigns each symbol its type.
In Stateflow charts and tables, you can use the Symbols pane to trace between the chart or table and non-graphical elements. When you select an element in the Symbols pane, Stateflow highlights the sections of the chart that use that symbol. Alternatively, when you select an element in your chart, Stateflow highlights the data, event, or message in the Symbols pane.
To control element and symbol highlighting, select the Preferences button
![]() . A drop-down menu appears.
. A drop-down menu appears.

To highlight symbols in the Symbols pane, select Highlight used symbols. To highlight elements in the chart, select Highlight uses on diagram to highlight:
The uses of the data, event, or message in the chart.
The graphical objects that read the data, event, or message.
The graphical objects that write to the data, event, or message.
Open the model
sf_tetris2.openExample("sf_tetris2")Double-click the chart
TetrisLogic. In the Symbols pane, when you selectARENA_HEIGHT, the chat highlights the states and functions that useARENA_HEIGHTin blue.
To see which chart elements use
ARENA_HEIGHT, open the functionfreeze.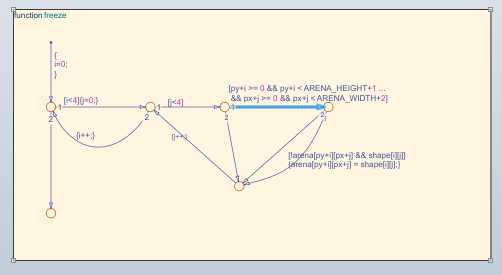
Limitations
When you add data, events, or messages in the Symbols pane, the parent is the top level chart.
You cannot undo scope changes to data parented by graphical functions, MATLAB functions, and truth tables.
You cannot undo renaming an element in a truth table.
If you delete data for elements in a Simulink based state, the element remains in your Simulink based state and the data appears as undefined in the Symbols pane.
Version History
Introduced in R2016b