Robot Trajectory Planning with Reusable Components
This example shows how to use entry and exit ports to create multiple connections into and out of linked atomic subcharts. Entry and exit ports enable your chart to transition across boundaries in the Stateflow® hierarchy while isolating the logic for entering and exiting atomic subcharts. For more information about entry and exit ports, see Create Entry and Exit Connections Across State Boundaries.
In this example, a Simulink® model simulates a robot that maneuvers through an obstacle course in search of a docking station. The model contains three Stateflow charts:
Route Controldefines the strategy used by the robot to search for the dock and navigate the obstacle course.Robotdefines the physical characteristics of the robot, such as position and direction of motion, in relation to the dock and the obstacles that surround it.Plot Trajectorycreates a visual representation of the path that the robot takes as it avoids obstacles and searches for the dock.
![]()
Define Search Strategy
The Route Control chart defines the strategy that the robot uses to search for the docking station. The chart consists of a combination of linked atomic subcharts from the Simulink library model sfRobotExampleLib.slx. The linked atomic subcharts behave as macros that instruct the robot to move forward, rotate left or right, and make radio contact with the dock. You can combine one or more instances of these subcharts to program your own search strategy.
![]()
In this example, the robot moves in a straight line and makes radio contact with the dock at regular intervals. If the robot senses that it is moving away from the dock, it rotates 45 degrees to the right and continues searching. If the robot runs into an obstacle, it rotates 45 degrees to the left and continues searching. Initially, the robot moves with a speed of 0.5 meters per second. When the robot comes within 2 meters of the dock, it slows down to a speed of 0.1 meters per second. When the robot comes close to the docking station, the simulation stops. Otherwise, after tMax seconds, the simulation stops and returns a warning.
Create Multiple Entry Connections into Subchart
In the Route Control chart, the linked atomic subchart Rotate contains two entry ports labeled Left and Right. During simulation, the Rotate subchart becomes active when the chart takes a transition that leads to one of these entry ports.
Inside the subchart, each entry port has a matching entry junction. The transitions that connect from these entry junctions to the state Rotate set the value of the local data object direction to 1 or -1. This value tells the robot whether to turn clockwise or counterclockwise. Then, the state entry action calls the rotate function in the Robot chart. This function changes the direction of motion for the robot by an angle of direction*angle. The parameter angle is specified as pi/4 in the Mappings tab of the properties dialog box for the subchart. For more information, see Map Variables for Atomic Subcharts and Boxes.
Create Multiple Exit Connections Out of Subchart
The linked atomic subchart Move contains two exit ports labeled Done and HIT. Inside the subchart, each exit port has a matching exit junction. During simulation, the state actions in the substate Forward call the move function in the Robot chart. This function changes the position of the robot by a distance of step, which is specified as 0.1 in the Mappings tab of the properties dialog box for the subchart. If the function obstacle indicates that the robot collided with an obstacle, the robot returns to the last safe position and the chart transitions out of the subchart by using the exit port HIT. Otherwise, the robot continues to move forward for a full second and the chart transitions out of the subchart by using the exit port Done.
Similarly, the linked atomic subchart ContactDock contains two exit ports, CloserToDock and FartherFromDock. Inside the subchart, each exit port has a matching exit junction. During simulation, the state actions in the substate ContactDock call the distanceToDock function in the Robot chart. This function determines the distance from the robot to the docking station. If this distance decreased in the last time step, the chart transitions out of the subchart by using the exit port CloserToDock. Otherwise, the chart transitions out of the subchart by using the exit port FartherFromDock.
![]()
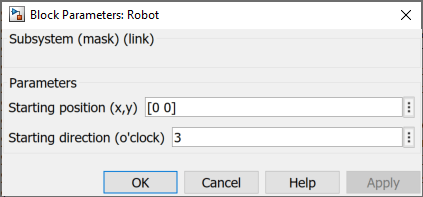
Model Physical Environment and Obstacle Course
The Robot chart maintains the position and direction of the robot. The chart also exports several functions to move and rotate the robot, determine the distance from the robot to the dock, and detect obstacles. By calling these functions, the Route Control chart never interacts directly with position and direction of the robot.
![]()
The mask parameters Starting Position (x,y) and Starting direction (o'clock) specify the values of startPos and startDir. To modify these values, open the Block Parameters dialog box by double-clicking the Robot chart. For more information, see Create a Mask to Share Parameters with Simulink.
The workspace variables dock, dockWidth, circles, and boxes specify the position and size of the docking station and the obstacles around it.
dockis a two-element vector that specifies the horizontal and vertical coordinates of the dock.dockWidthis a scalar that specifies the width of the dock.circlesis an -by-3 matrix that specifies the horizontal coordinate, the vertical coordinate, and the radius of each circular obstacle, where is the number of circular obstacles.
boxesis an -by-4 matrix that specifies the horizontal coordinate, the vertical coordinate, the width, and the height of each rectangular obstacle, where is the number of rectangular obstacles.
The obstacle course can contain arbitrarily many obstacles, but it must contain at least one circular and one rectangular obstacle. By default, the PreLoadFcn callback for the model in this example defines an obstacle course with three circular obstacles and three rectangular obstacles.
Package Reusable Components in a Library
The Robot chart is a library chart that is linked from the Simulink library model sfRobotExampleLib.slx. This library includes an all-in-one toolkit that defines this chart as well as the linked atomic subcharts for programming your own robot simulation. For more information, see Libraries and Blocksets (Simulink).
![]()
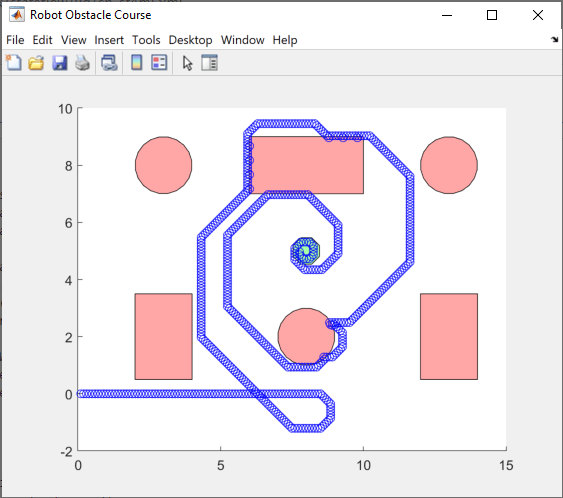
Plot Robot Trajectory
The chart Plot Trajectory reads the workspace variables dock, dockWidth, circles, and boxes, as well as the output signals x and y from the Robot chart and done from the Route Control chart to produce a visual representation of the obstacle course and the path that the robot takes as it searches for the dock.
![]()
When you start the simulation, the chart calls the helper function sfRobotScene to create a MATLAB® figure that shows the docking station in green and the obstacles in red. The code for this function appears at the end of this example. Then, at each step of the simulation, the chart plots the location of the robot by using a blue circle. When the input signal done indicates the end of the simulation, the chart plots the final location of the robot and sets the value of the output signal stop to true, causing the Stop block to end the simulation.
To call sfRobotScene, plot, and hold as extrinsic functions, the chart uses the coder.extrinsic (Simulink) function. For more information, see Call Extrinsic MATLAB Functions in Stateflow Charts.
Display Elements of Obstacle Course
The helper function sfRobotScene creates a MATLAB figure that shows the docking station in green and the obstacles in red.
function sfRobotScene(dock,width,boxes,circles)

plot(nsidedpoly(8,Center=dock,Radius=2*width),FaceColor="green");
daspect([1 1 1])
hold on

for i = 1:height(circles)
    center = circles(i,1:2);
    radius = circles(i,3);
    plot(nsidedpoly(20,Center=center,Radius=radius),FaceColor="red");
end

for i = 1:height(boxes)
    box = boxes(i,:);
    X = [box(1) box(1)+box(3) box(1)+box(3) box(1)];
    Y = [box(2) box(2) box(2)-box(4) box(2)-box(4)];
    plot(polyshape(X,Y),FaceColor="red");
end

fig = gcf;
fig.Name = "Robot Obstacle Course";
fig.NumberTitle = 'off';
figure(fig)

end
See Also
plot | hold | coder.extrinsic (Simulink)