Schedule Execution of Multiple Controllers
In this tutorial, you use Simulink® functions in a Stateflow® chart to improve the design of a model that contains three function-call
subsystems. In the model sf_temporal_logic_scheduler:
The chart broadcasts the output events
A1,A2, andA3to trigger the function-call subsystems.The subsystems A1, A2, and A3 execute at different rates defined by the chart.
The subsystem outputs feed directly into the chart.
No other blocks in the model access the subsystem outputs.
You can replace function-call subsystems with Simulink functions inside a chart when:
The subsystems perform calculations required by the chart.
Other blocks in the model do not need access to the subsystem outputs.
Simulink functions are not supported in standalone Stateflow charts in MATLAB®. For more information, see Reuse Simulink Functions in Stateflow Charts.
Note
To skip the conversion steps, you can open the modified model by entering:
openExample("sf_temporal_logic_scheduler_with_sl_fcns")Open the Model
Open the sf_temporal_logic_scheduler model.
openExample("sf_temporal_logic_scheduler")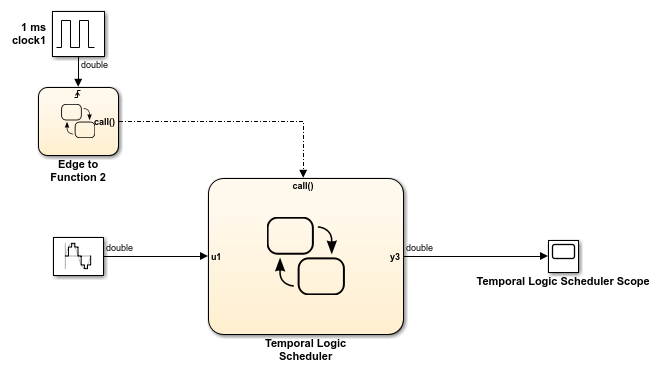
If you simulate the model, you see this result in the scope.

Add Simulink Functions to the Chart
Follow these steps to add Simulink functions to the Temporal Logic Scheduler chart.
In the Simulink model, right-click the A1 block in the lower right corner and select Cut from the context menu.

Open the Temporal Logic Scheduler chart.
In the chart, right-click outside any states and select Paste from the context menu.
Expand the new Simulink function so that the signature fits inside the function box.

Tip
To change the font size of a function, right-click the function box and select a new size from the Font Size menu.
Rename the Simulink function from
A1tof1by enteringy = f1(u)in the function box.Repeat steps 1 through 5 for these cases:
Copying the contents of A2 into a Simulink function named
f2.Copying the contents of A3 into a Simulink function named
f3.

Note
The new functions reside at the chart level because both states
FastSchedulerandSlowSchedulerrequire access to the function outputs.
Change the Scope of Chart Data
In the Model Explorer, change the scope of chart-level data y to
Local because the calculation for that data now occurs inside
the chart.
Update State Actions in the Chart
In the Stateflow Editor, you can replace event broadcasts in state actions with function calls.
Edit the state actions in
FastSchedulerandSlowSchedulerto call the Simulink functionsf1,f2, andf3.
In both states, update each
duringaction as follows.du: y = u1-y2;
Add Data to the Chart
For the on every state actions of FastScheduler
and SlowScheduler, define three data. (For details, see Add Stateflow Data.)
Add local data
y1andy2to the chart.Add output data
y3to the chart.In the model, connect the output for
y3to the scope.Tip
To flip the Scope block, select the block. Then, in the toolstrip, on the Format tab, click Flip left-right
 .
.
Remove Unused Items in the Model
In the Model Explorer, delete output events
A1,A2, andA3and input datau2because the function-call subsystems no longer exist.Delete any dashed signal lines from your model.
Run the New Model
Your new model looks something like this:

If you simulate the new model, the results match those of the original design.
Related Topics
Select a Web Site
Choose a web site to get translated content where available and see local events and offers. Based on your location, we recommend that you select: United States.
You can also select a web site from the following list
Americas
- América Latina (Español)
- Canada (English)
- United States (English)
Europe
- Belgium (English)
- Denmark (English)
- Deutschland (Deutsch)
- España (Español)
- Finland (English)
- France (Français)
- Ireland (English)
- Italia (Italiano)
- Luxembourg (English)
- Netherlands (English)
- Norway (English)
- Österreich (Deutsch)
- Portugal (English)
- Sweden (English)
- Switzerland
- United Kingdom (English)
Asia Pacific
- Australia (English)
- India (English)
- New Zealand (English)
- 中国
- 日本Japanese (日本語)
- 한국Korean (한국어)