Model and Debug a DC Motor in Stateflow
This example shows the model of a permanent magnet DC motor. The mode logic and dynamics of the DC motor are both modeled using Stateflow®.
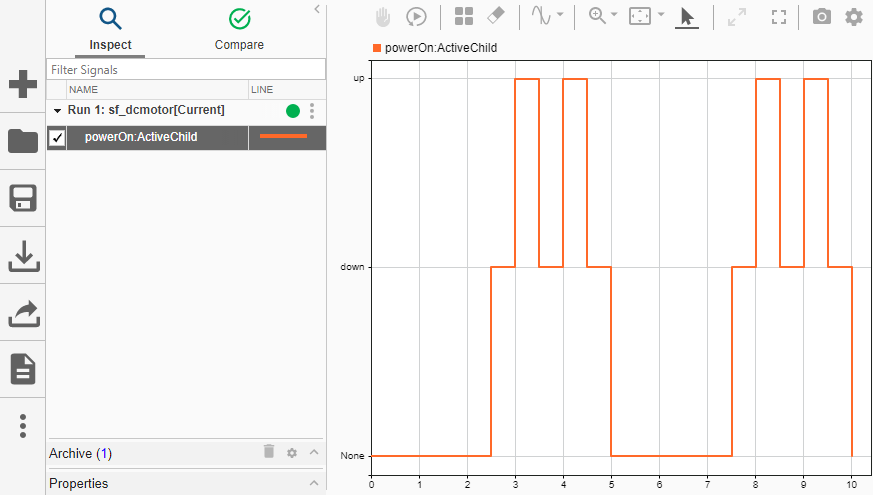
The DC motor state chart consists of two superstates: powerOn and powerOff. If the motor is powered on, it can be in one of two substates: up or down, signifying the direction of movement.
Note: This is a simplistic model of a DC motor. You can build more sophisticated DC motor models using Simscape™, which extends Simulink® with tools for modeling and simulating multidomain physical systems, such as those with mechanical, hydraulic, and electrical components.
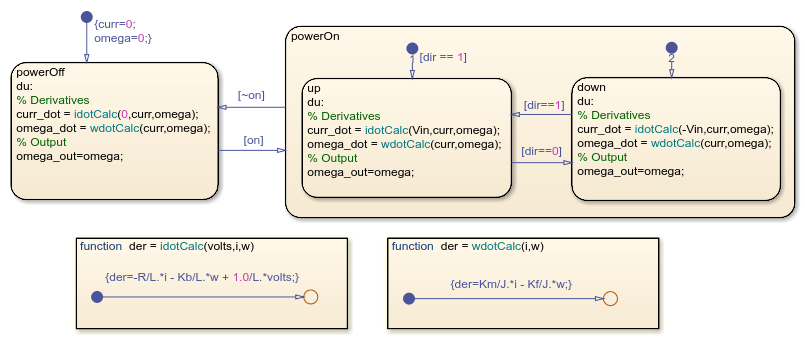
The dynamics of the motor are defined directly in the state chart using graphical functions and change depending on the state of the motor. For example, when the motor is in the powerOff state, the voltage applied is equal to zero. When the motor is in the powerOn state, the voltage applied is either positive or negative, depending on the direction of the motor.
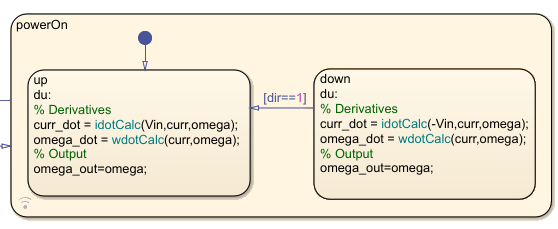
To review, the differential equations defining a permanent magnet DC motor are as follows:
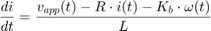
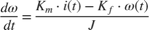
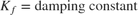
where


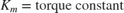
Enable Active State Output
To enable active state output monitoring, first select the powerOn state. Then, in the Simulation tab, click Log Child Activity.
Run the simulation.
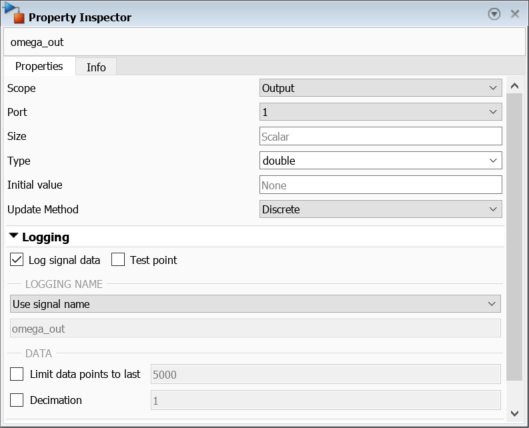
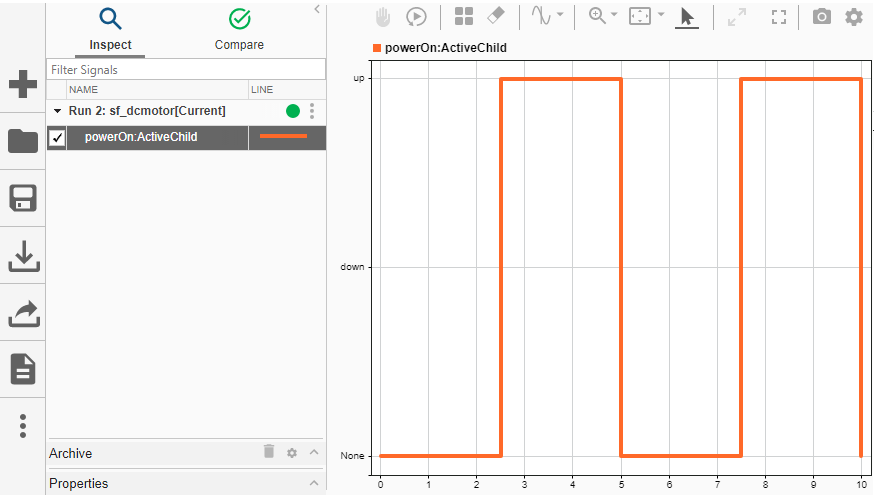
In the Review Results section of the Simulation tab, the Data Inspector button is highlighted, meaning that there is a logged signal available to view. Click the Data Inspector button, to view the simulation data.
In this plot, the orange data shows which child state of powerOn is active. The plot shows that the child states alternate between down and up.
Debugging with Active State Output
You can use also active state output to help you debug your Stateflow charts. For this portion of the example, introduce an error in your Stateflow chart by removing the transition from up to down. Remove the default transition from down, and delete the condition on the default transition to up.
Run the simulation.
Again, the Data Inspector button shows that there is new logged data. Open the Data Inspector to look at the signal.
In this plot, you can see the only child state of powerOn that becomes active is up.