Design Charts with Simulink Functions
In this tutorial, you use a Simulink® function in a Stateflow® chart to improve the design of a model that contains a function-call subsystem. You can replace a function-call subsystem with a Simulink function in a chart when:
The subsystem performs calculations required by the chart.
Other blocks in the model do not need access to the subsystem outputs.
For more information, see Reuse Simulink Functions in Stateflow Charts.
Note
To skip the conversion steps, you can open the modified model by entering:
openExample("old_sf_car_with_sl_function")Open the Model
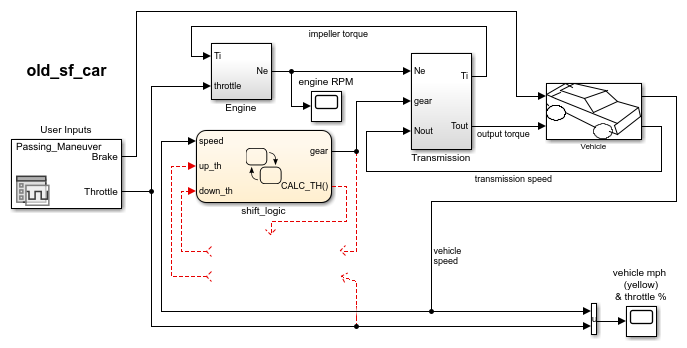
Open the model old_sf_car. This model contains a function-call subsystem named Threshold Calculation and a Stateflow chart named shift_logic.
![]()
When you run this model, the chart broadcasts the output event CALC_TH to trigger the function-call subsystem. The subsystem interpolates two values for the shift_logic chart. The subsystem outputs (up_th and down_th) return to the chart as inputs.
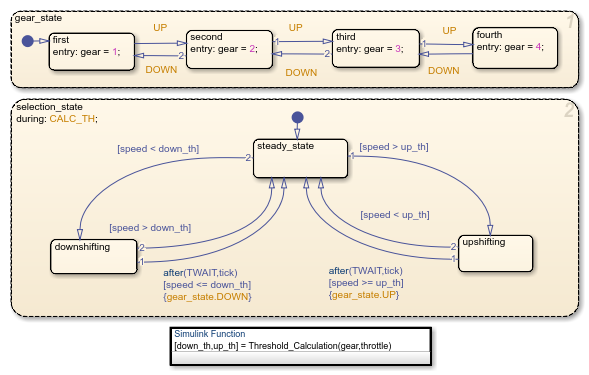
After the simulation, the engine RPM Scope block displays these results.
![]()
Add a Simulink Function to the Chart
Follow these steps to add a Simulink function to the shift_logic chart.
In the Simulink model, right-click the Threshold Calculation block in the lower left corner, click the arrow
 , and then click the Cut button
 .
.
Open the shift_logic chart.
In the chart, right-click below
selection_stateand select Paste from the context menu.Expand the new Simulink function so that the signature fits inside the function box.
Tip
To change the font size of a function, right-click the function box and select a new size from the Font Size menu.
Expand the border of
selection_stateto include the new function.
Note
The function resides in this state instead of the chart level because no other state in the chart requires the function outputs
up_thanddown_th. See Bind a Simulink Function to a State.Rename the Simulink function from
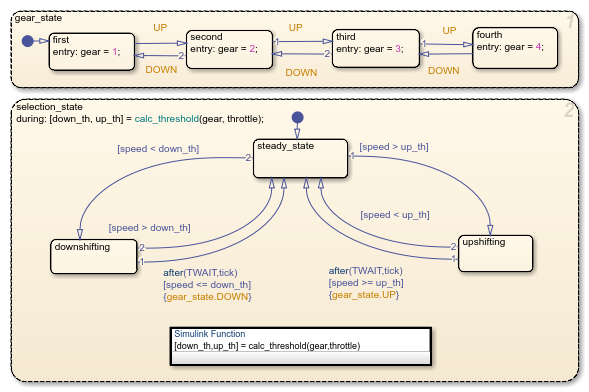
Threshold_Calculationtocalc_thresholdby entering[down_th, up_th] = calc_threshold(gear, throttle)in the function box.
Change the Scope of Chart Data
In the Model Explorer, change the scope of chart-level data up_th and
down_th to Local because calculations for
those data now occur inside the chart.
Update State Action in the Chart
In the Stateflow Editor, change the during action in
selection_state to call the Simulink function
calc_threshold.
during: [down_th, up_th] = calc_threshold(gear, throttle);
Add Data to the Chart
Because the function calc_threshold takes throttle
as an input, you must define that data as a chart input. (For details, see Add Stateflow Data.)
Add input data
throttleto the chart with a Port property of 1.Using port 1 prevents signal lines from overlapping in the Simulink model.
In the Simulink model, add a signal line for
throttleto an input to the Engine block and to an input to the shift_logic chart.
Remove Unused Items in the Model
In the Model Explorer, delete the function-call output event
CALC_THbecause the Threshold Calculation block no longer exists.Delete any dashed signal lines from your model.
Run the New Model
Your new model looks something like this:
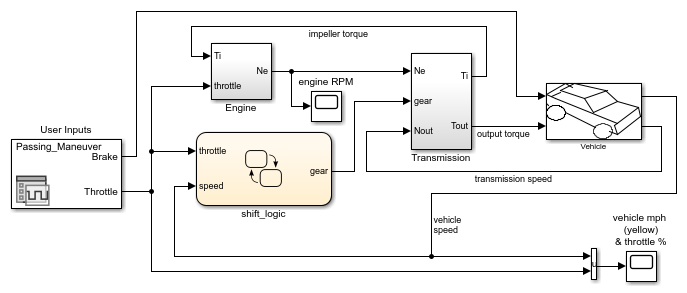
If you simulate the new model, the results match those of the original design.