Convert MATLAB Code into Stateflow Flow Charts
To transform your MATLAB® code into Stateflow® flow charts and graphical functions, use the Pattern Wizard. Supported patterns for conversion include:
if,if-else, and other nested decision statements.forandwhileloops.switchstatements.
The Pattern Wizard can convert MATLAB functions and scripts.
MATLAB functions are converted to Stateflow graphical functions.
MATLAB scripts are converted to Stateflow flow charts.
Converting MATLAB code is supported only in standalone Stateflow charts. For more information, see Create Stateflow Charts for Execution as MATLAB Objects.
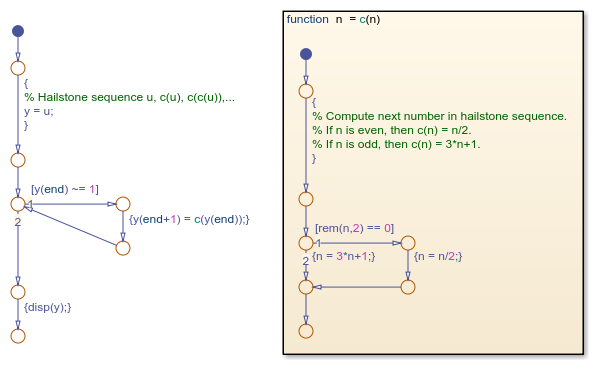
Create Flow Charts from MATLAB Scripts
This MATLAB script empirically verifies one instance of the Collatz conjecture. When
given the numeric input u, the script computes the hailstone sequence n0 = u,
n1,
n2,
n3, ⋯ by iterating this rule:
If ni is even, then ni+1 = ni/2.
If ni is odd, then ni+1 = 3ni + 1.
The Collatz conjecture states that every positive integer has a hailstone sequence that eventually reaches one.
% Hailstone sequence u, c(u), c(c(u)),...
y = u;
while y(end) ~= 1
    y(end+1) = c(y(end));
end
disp(y);

function n = c(n)
% Compute next number in hailstone sequence.
% If n is even, then c(n) = n/2.
% If n is odd, then c(n) = 3*n+1.
    if rem(n,2) == 0
        n = n/2;
    else
        n = 3*n+1;
    end
end
while loop that repeatedly calls the auxiliary
function c until it produces an output value of one. The function
c consists of a conditional
if-else statement whose output depends on the
parity of the input.To convert this script into a flow chart and a graphical function:
Open a new standalone chart.
edit hailstone.sfxOn the State Chart tab, select Pattern > Select File.
In the dialog box, choose the MATLAB script and click Open. The Pattern Wizard adds a flow chart and a graphical function to your Stateflow chart. Double-click the graphical function to see its contents.
In the Symbols pane, click Resolve Undefined Symbols
 . The Stateflow Editor resolves
 uandyas local data.Save your chart.
To execute the chart from the Stateflow Editor, in the Symbols pane, enter a value of
u= 9 and click Run . While the flow chart is executing, the
Stateflow Editor highlights the active transitions through chart animation.
When the execution stops, the MATLAB Command Window displays the hailstone sequence, starting with a
value of nine:
. While the flow chart is executing, the
Stateflow Editor highlights the active transitions through chart animation.
When the execution stops, the MATLAB Command Window displays the hailstone sequence, starting with a
value of nine:9 28 14 7 22 11 34 17 52 26 13 40 20 10 5 16 8 4 2 1
Click Stop
 .
.
You can copy generated flow charts and graphical functions and paste them in other charts, including Stateflow charts in Simulink® models. If your MATLAB code uses functionality that is restricted for code generation in Simulink, you must modify the flow chart actions before simulating the chart. For more information, see Call Extrinsic MATLAB Functions in Stateflow Charts.
Note
Suppose that you use nargin in a MATLAB function that you convert to a graphical function in a chart. Because
nargin counts the chart object as one of the input arguments of
the graphical function, the value of nargin in the graphical
function is equal to one plus the value of nargin in the original
MATLAB function. For more information, see Execute a Standalone Chart.