Compound Motor Design Optimization
This example shows how to find design parameters that optimize a compound motor torque-speed curve to match the desired curve.
This example uses the fminsearch optimization algorithm. You can also use other optimization tools available in the Optimization Toolbox™, or develop your own.
Model Overview
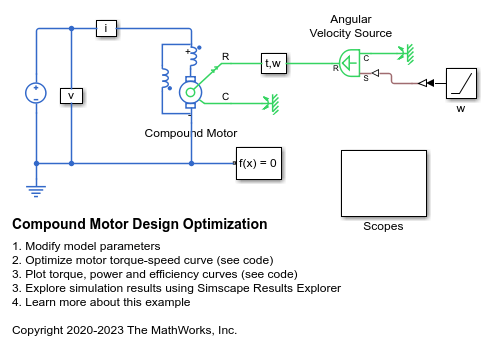
The compound motor has a DC supply voltage and the shaft motion is a ramp angular velocity. Ideal sensors measure torque and current to compute torque-speed, power-speed, and efficiency-speed curves.

Modify Parameters
Open the data script to modify parameters that remain constant during optimization such as supply voltage and rotor damping. You can also choose the desired torque-speed curve used in the objective function by modifying nominal speed, nominal torque, and torque-speed slope at nominal speed.
Optimization
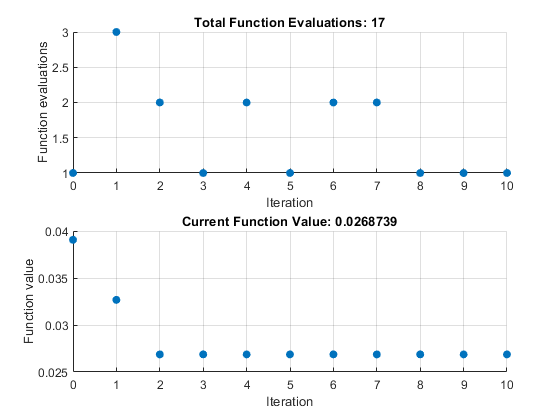
To find the minimum of a provided objective function, given an initial guess x0, this example uses the fminsearch optimization function. The objective function used is the maximum distance between the actual speed curve and the desired speed curve. The parameters to optimize are the parallel field winding resistance, the total back EMF constant and the ratio of parallel field-winding back EMF to total back EMF
 Iteration   Func-count         f(x)         Procedure
     0            1        0.0390632
     1            4        0.0326724         initial simplex
     2            6        0.0268741         expand
     3            7        0.0268741         reflect
     4            9        0.0268741         contract inside
     5           10        0.0268741         reflect
     6           12        0.0268741         contract inside
     7           14        0.0268741         contract outside
     8           15        0.0268741         reflect
     9           16        0.0268741         reflect
    10           17        0.0268741         reflect

Exiting: Maximum number of iterations has been exceeded
         - increase MaxIter option.
         Current function value: 0.026874

*****************************
Optimal minimized cost: 0.026874 N*m
*****************************
Motor parameters that produce the minimum distance to the desired torque-speed curve:
Optimal parallel field winding resistance = 225 Ohm
Optimal total back EMF = 1.365 H
Optimal ratio of parallel field winding back EMF divided by total back EMF = 0.42
*****************************


Simulation Results
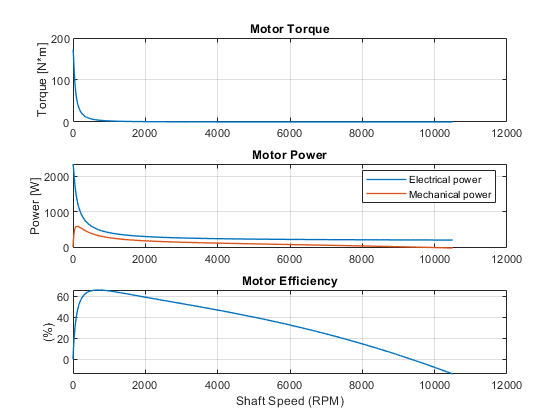
Plot torque-speed, power-speed, and efficiency-speed curves over an extended range of shaft speeds.

Results from Real-Time Simulation
This example has been tested on a Speedgoat Performance real-time target machine with an Intel® 3.5 GHz i7 multi-core CPU. This model can run in real time with a step size of 50 microseconds.