Estimate Parameters and States
This topic shows how to estimate parameters and states in the Parameter Estimator.
To estimate parameters and states after you have specified estimation data, parameters, and estimation options:
Specify experiments for estimation.
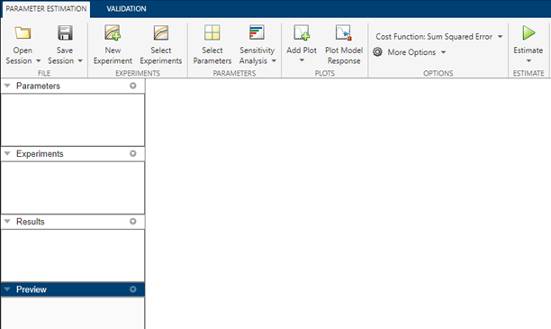
In the Parameter Estimator, in the Parameter Estimation tab, click Select Experiments. In the Select Experiments dialog box, in the Estimation column, select the experiment to use.
If you define more than one experiment, you can specify the relative contributions of different experiments to parameter estimation by setting weights for the experiments. In the Weight column, specify the weight of each experiment as a real nonnegative scalar. The weights you specify apply only to estimation and not validation. By default, all weights are set to 1.
During optimization, when calculating the objective to minimize, the software uses the specified weights as multiplicative factors. That is,
Error
                        Objective = Residual Error * Signal Weights * Experiment Weight
. For more information on signal weights, see Edit Experiment Data.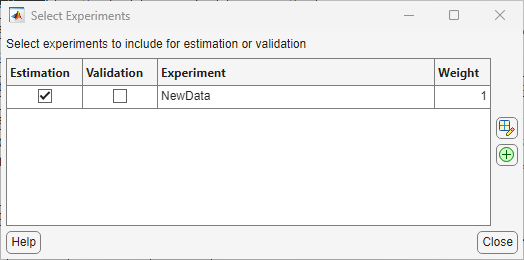
For information about the Validation column, see Validate Estimation Results.
(Optional) Create progress plots to view estimation progress.
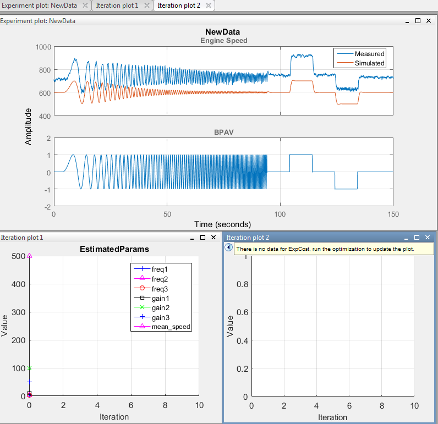
When you start the estimation, the app automatically displays a parameter trajectory plot that shows the change in the parameter values during estimation. You can create other plots for viewing the progress of the estimation before you begin estimating the parameters. During estimation, all these plots update with each iteration.
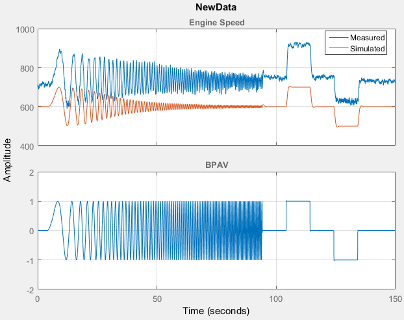
To plot the measured data, on the Parameter Estimation tab, click Add Plot. Select the experiment to use for estimation under Experiment Plots of the drop-down list.
To add the simulated response to the measured data plot, on the Parameter Estimation tab, click Plot Model Response.
Alternatively, right-click the experiment name in the Experiments area of the app, and select Plot measured & simulated data from the menu.
You can edit the labels, adjust the limits, change the units, and the font style of the plot in the Property Editor. To open the editor, right-click the experiment plot and select Properties from the list.
To plot the parameter values as they change, click Add Plot, and select Parameter Trajectory. To add the scaled values or save iteration data, right-click the plot.
To add a plot for the estimation cost, click Add Plot, and select Estimation Cost. To add the scaled values or save iteration data, right-click the plot.
Use the View tab of the app to arrange the layout of the plots, so that all the progress plots you created are visible.
Estimate the parameters and states.
In the Parameter Estimation tab, click
 Estimate.
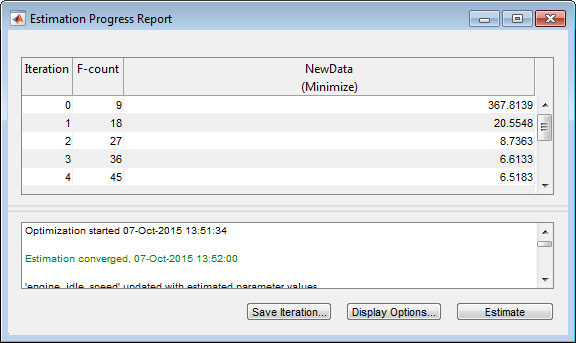
An Estimation Progress Report window opens at the start of estimation. The report and progress plots update with each iteration.
View the Estimation Progress Report after the estimation completes.
By default, the report displays the iteration number (Iteration), the number of times the objective function is calculated (F-count), and cost function value (f(x), for example, NewData(Minimize)). You can change the display table by clicking Display Options. To learn more about the display table, see Iterative Display.
View the estimated results.
The estimation results are saved in a new variable,
EstimatedParams, in the Results area of the app.To view the contents of the variable, right-click
EstimatedParamsand select Open... from the menu.EstimatedParamsincludes the values of the parameters, the cost function value, and information about the stopping criteria for the estimation.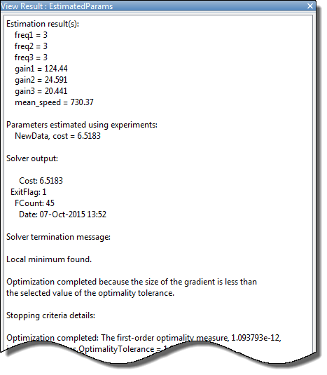
View the progress plots.
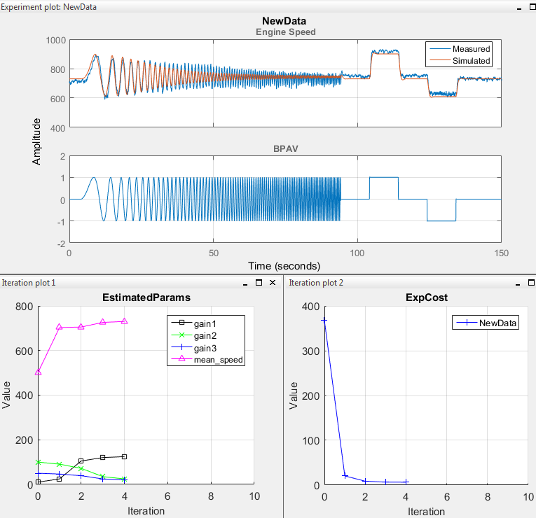
The measured versus simulated data plot shows how closely the simulated data matches the measured estimation data. The estimated parameters plot and cost function plots show the changes in the estimated value of the parameters and estimated cost function for each iteration.
Typically, a lower cost function value indicates the model simulation with the estimated parameters closely matches experimental data. If the optimization went well, you should see your cost function converge to a minimum value. The lower the cost, the more successful the estimation.
For information on types of problems you may encounter using optimization solvers, see When the Solver Fails, When the Solver Might Have Succeeded, and When the Solver Succeeds.