Design Optimization to Meet Time-Domain and Frequency-Domain Requirements (GUI)
This example shows how to tune a controller to satisfy time-domain and frequency-domain design requirements using the Response Optimizer app.
Aircraft Longitudinal Flight Control Model
Open the Simulink® model.
sys = "sdoAircraft";
open_system(sys)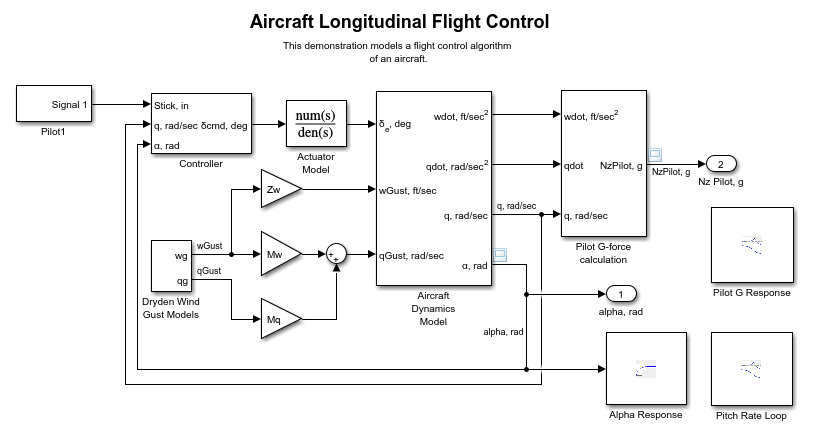
The aircraft model is based on the Simulink slexAircraftExample model. The model includes:
Subsystems to model aircraft dynamics (
Aircraft Dynamics Model), wind gusts (Dryden Wind Gust Models), and pilot G-forces (Pilot G-force calculation).A step change applied to the aircraft joystick at 1 second into the simulation that causes the aircraft to pitch upward.
Controller Design Problem
You tune the controller gains to meet the following time-domain and frequency-domain design requirements:
Angle-of-attack
alpharesponse to a step change in the joystick has a rise time of less than 1 second, less than 1% overshoot, and settles to within 1% of steady state within less than 5 secondsPitch-rate control loop has good tracking below 1 rad/s and 20 dB noise rejection above 100 rad/s
Closed-loop response from joystick to pilot G-Force is below 0 dB above 5 rad/s.
These requirements reduce the high frequency G-forces experienced by the pilot in response to joystick changes while still maintaining flight performance.
The model includes the following blocks (from Simulink® Design Optimization™ and Simulink Control Design Model Verification libraries):
Alpha Responsespecifies the alpha step response requirement.

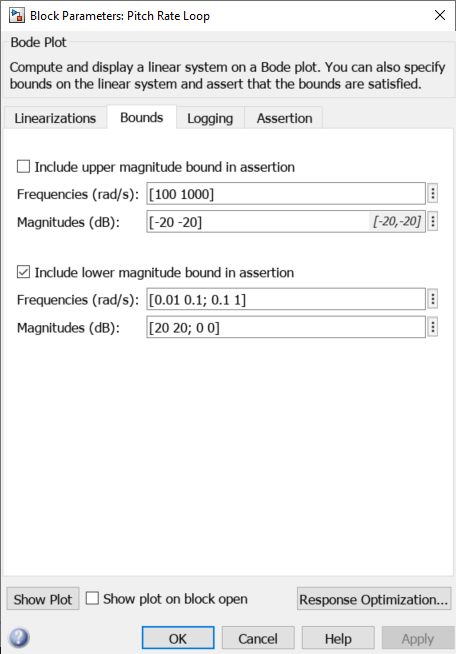
Pitch Rate Loopspecifies the pitch-rate performance requirement.
The linearization inputs/outputs are already selected in the Linearizations tab. The pitch-rate loop starts from the input of the controller (the controller error signal) and ends at the output of the pitch-rate sensor. The angle-of-attack loop is opened signal so that the block only computes the pitch-rate loop response. The linear system is computed at a simulation time of 0.

The Bounds tab specifies the following pitch-rate loop shape requirements:
Greater than 20 dB over the range 0.01 rad/s to 0.1 rad/s
Greater than 0 dB over the range 0.1 rad/s to 1 rad/s
Less than -20 dB over the range 100 rad/s to 1000 rad/s
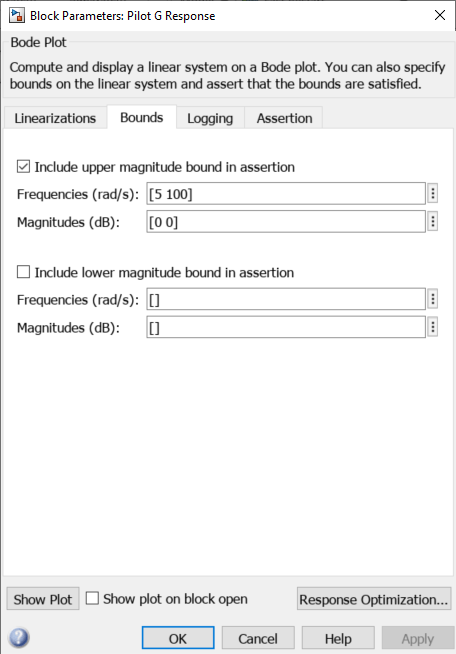
Pilot G Responsespecifies the G-force requirement.
The linearization inputs/outputs are already selected in the Linearizations tab. The linear system is computed at a simulation time of 0.

The Bounds tab specifies the G-force requirements of less than 0 dB over the range 5 rad/s 100 rad/s.
Open the Response Optimizer
Open the Response Optimizer to configure and run design optimization problems interactively. Click Response Optimization on the Block Parameters dialog box of Alpha Response, Pitch Rate Loop or Pilot G Response block. Alternatively, type sdotool("sdoAircraft"). To show multiple requirement plots at the same time, use the View tab in the app.

The app detects the requirements specified in the Model Verification blocks and automatically includes them as requirements to satisfy.
Specify Design Variables
Specify the following model parameters as design variables for optimization:
Controller gains
KiandKfPitch-rate sensor gain
KqAlpha sensor gain
Ka
In the Design Variables Set drop-down list, select New. A dialog box to select model parameters for optimization opens.
Select Ki, Kf, Kq and Ka. Click C to add the selected parameters to the design variables set.
Specify minimum and maximum gain values, the Ki and Kf values must remain negative while Ka and Kq must remain positive.
Press Enter after you enter the values.
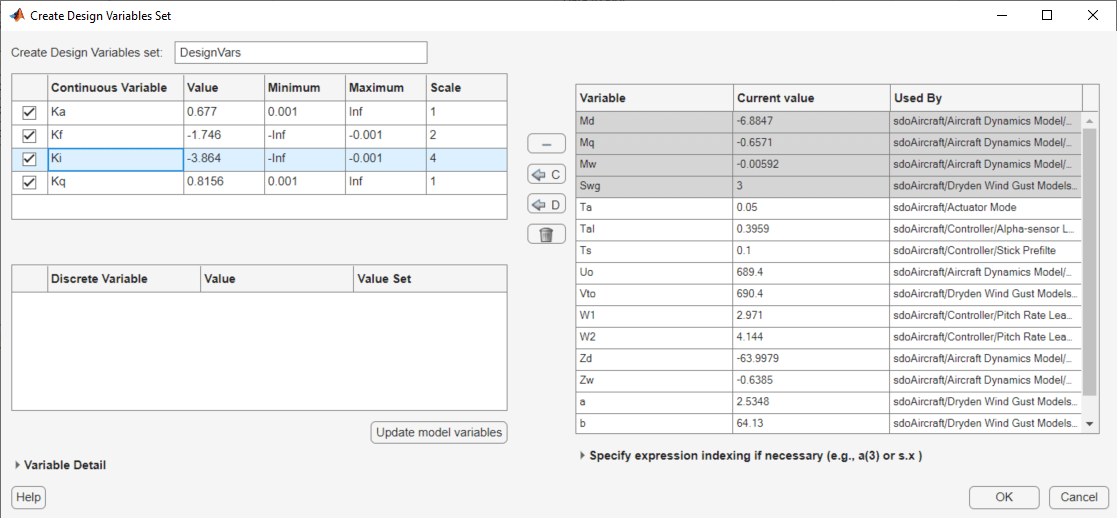
Click OK. A new variable DesignVars appears in the Response Optimizer browser.
Evaluate the Initial Design
Click Plot Model Response to simulate the model and check how well the initial design satisfies the design requirements.
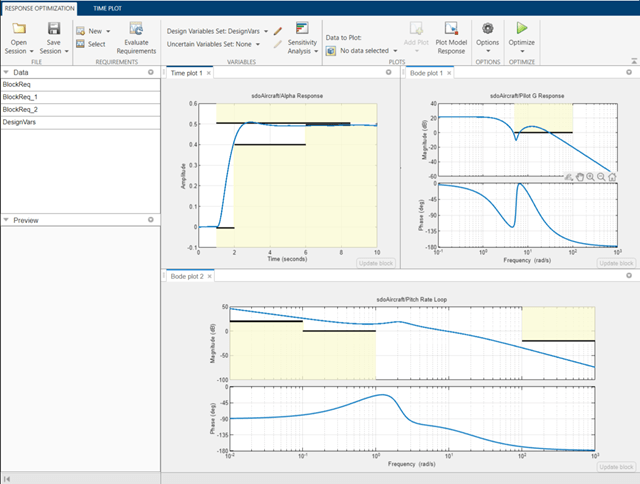
The plots indicate that the current design does not satisfy the pilot G-force requirement and the alpha step response overshoot requirement is violated.
Optimize the Design
Create a plot to display how the controller variables are modified during the optimization. In the Data To Plot drop-down list, select DesignVars, which contains the optimization design variables Ki, Kf, Kq and Ka. In the Add Plot drop-down list, select Iteration plot.

Click Optimize.
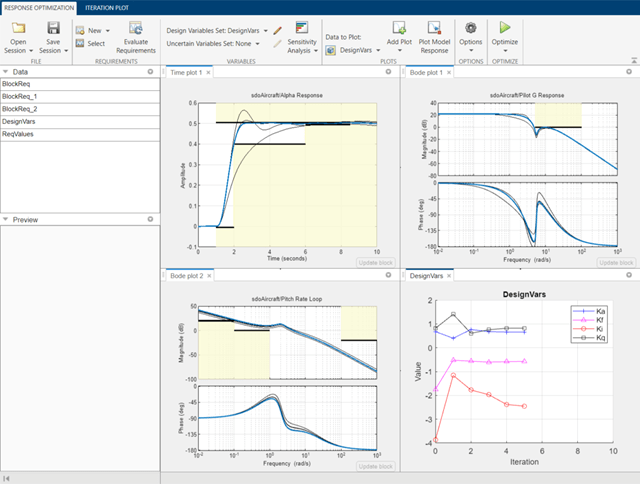
To load a pre-configured file and run the optimization, click Open on the Response Optimization tab and select sdoAircraft_sdosession.mat. Alternatively load the project by typing:
load sdoAircraft_sdosession
sdotool(SDOSessionData)
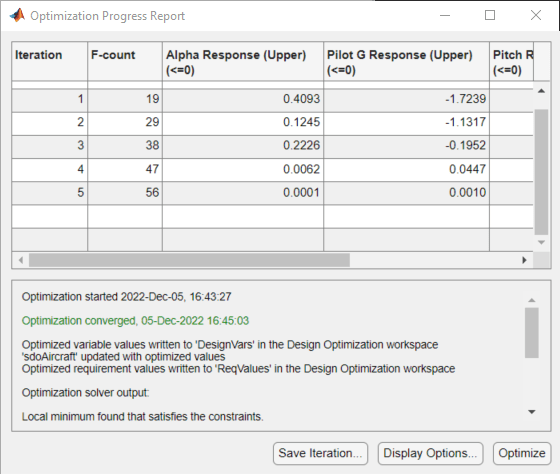
The optimization progress window updates at each iteration and shows that the optimization converged after 5 iterations.
The Alpha Response and Pilot G Response plots indicate that the design requirements are satisfied. The DesignVars plot shows that the controller gains converged to new values.
To view the optimized design variable values, click DesignVars in the Response Optimizer browser. The optimized values of the design variables are automatically updated in the Simulink model.
See Also
Apps
Blocks
- Check Step Response Characteristics | Bode Plot, Check Bode Characteristics (Simulink Control Design)